我们部门每个月都要召开一次月度经营分析大会,所以免不了做PPT来做报告。而大家都知道,在PPT里面据实引用数据会更加有说服力,然而,再添加一些比较炫酷又合理的可视化图表,会增色不少(更具视觉冲击力)!
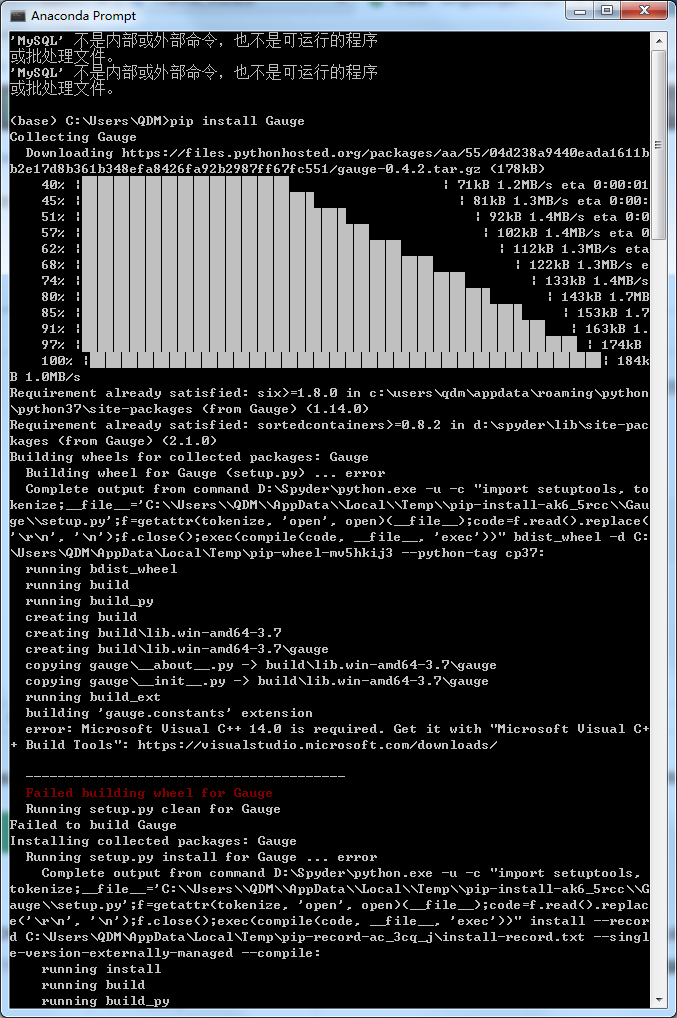
先在Anaconda里面安装pyecharts和Gauge这两个模块,指令如下:
pip install pyecharts
pip install Gauge
接下来就可以写代码来实现可视化了:
#仪表盘
from pyecharts import options as opts
from pyecharts.charts import Gauge, Page


c = (
        Gauge()
        .add("",
             [("综合达成率", 66.67)]
             #设置颜色
            #,axisline_opts=opts.AxisLineOpts(linestyle_opts=opts.LineStyleOpts(color=[(0.3, "#67e0e3"), (0.7, "#37a2da"), (1, "#fd666d")], width=30))
            )
        .set_global_opts(title_opts=opts.TitleOpts(title="4月份实际销售额"))
)
c.render_notebook()
#仪表盘
from pyecharts import options as opts
from pyecharts.charts import Gauge, Page


c = (
        Gauge()
        .add("",
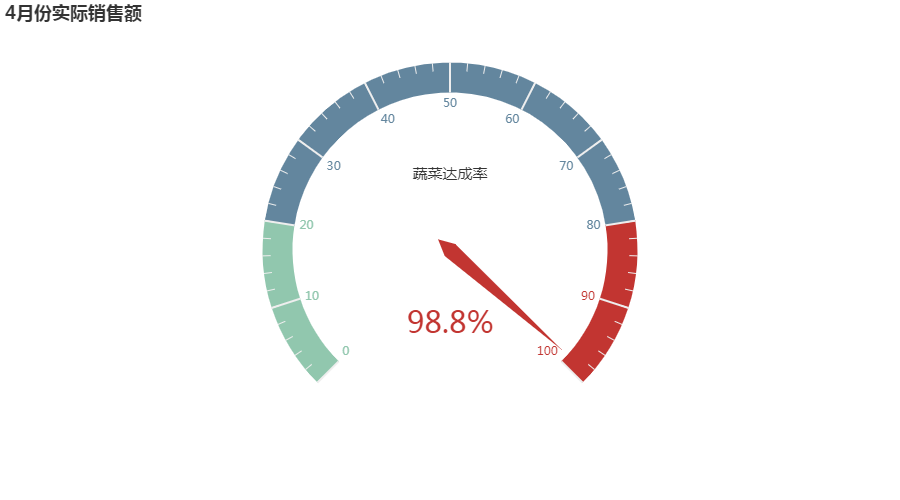
             [("蔬菜达成率", 98.8)]
             #设置颜色
            #,axisline_opts=opts.AxisLineOpts(linestyle_opts=opts.LineStyleOpts(color=[(0.3, "#67e0e3"), (0.7, "#37a2da"), (1, "#fd666d")], width=30))
            )
        .set_global_opts(title_opts=opts.TitleOpts(title="4月份实际销售额"))
)
c.render_notebook()
#仪表盘
from pyecharts import options as opts
from pyecharts.charts import Gauge, Page


c = (
        Gauge()
        .add("",
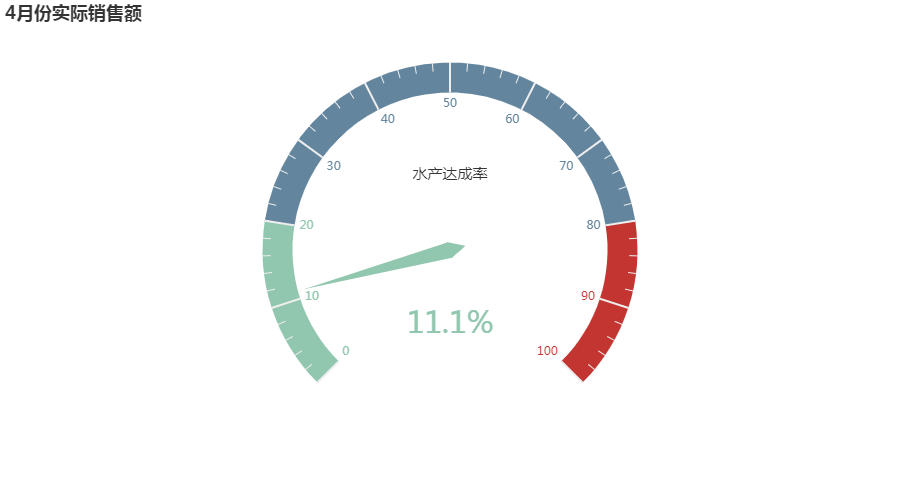
             [("水产达成率", 11.1)]
             #设置颜色
            #,axisline_opts=opts.AxisLineOpts(linestyle_opts=opts.LineStyleOpts(color=[(0.3, "#67e0e3"), (0.7, "#37a2da"), (1, "#fd666d")], width=30))
            )
        .set_global_opts(title_opts=opts.TitleOpts(title="4月份实际销售额"))
)
c.render_notebook()
小结:用仪表盘来表示进度(达成率/完成率),可以在视觉上给观众一种新颖的感觉,只要需要用到的时候,把这段代码复制粘贴,修改一下参数,运行结果即可得到想要的上述类型可视化图表。
来源:oschina
链接:https://my.oschina.net/u/3750423/blog/4267580