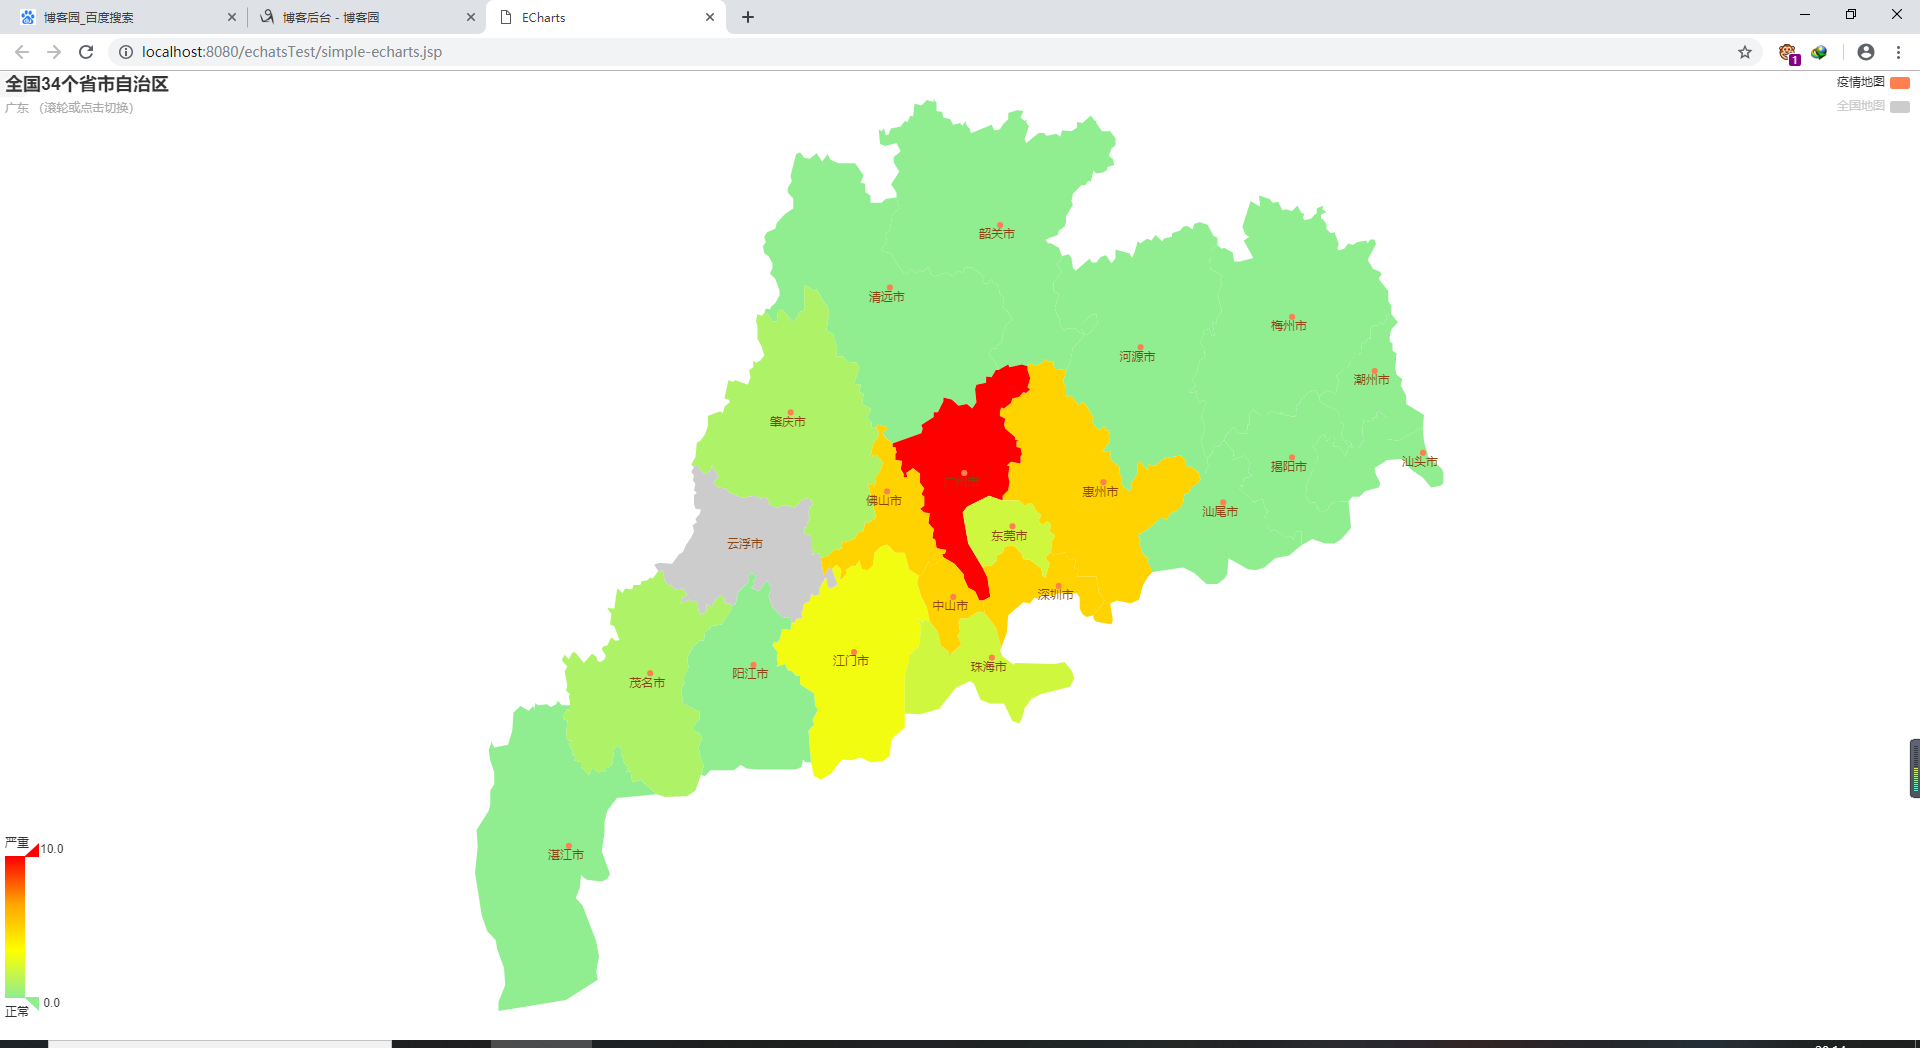
爬取新型冠状病毒疫情信息。并生成echarts疫情分布地图
主要爬取代码如下:
package type;

import java.io.BufferedReader;
import java.io.IOException;
import java.io.InputStream;
import java.io.InputStreamReader;
import java.net.HttpURLConnection;
import java.net.URL;
import java.text.ParseException;
import java.text.SimpleDateFormat;
import java.util.Date;
import java.util.List;
import java.util.Objects;

import com.google.gson.JsonArray;
import com.google.gson.JsonObject;
import com.google.gson.JsonParser;

public class HtmlParser {
    public static void main(String args[])
    {
        StringHandle sh=new StringHandle();
        FileHandle fh=new FileHandle();
        String infos=getURLInfo("https://view.inews.qq.com/g2/getOnsInfo?name=disease_h5&callback=&_="+System.currentTimeMillis(),"utf-8");
        infos=infos.replaceAll("\\\\", "");
        infos=infos.replaceAll("\\\"\\{", "{");
        infos=infos.replaceAll("\\}\"", "}");
        infos=infos.replaceAll("(\\{|\\}|,)", "\r\n$1\r\n");
        List<String> list=sh.getExpString("\\{[\\s\\S]*\\}", infos);
        infos=list.get(0);

        System.out.println(infos);
        fh.outFile(infos, "C:\\Users\\Halo\\Desktop\\大学决定\\寒假作业\\网页爬取\\test1.txt", false);

        JsonParser parse =new JsonParser();  //创建json解析器
        JsonObject json=(JsonObject) parse.parse(infos);  //创建jsonObject对象
        JsonObject paramzObject = json.getAsJsonObject("data");
        String date=paramzObject.get("lastUpdateTime").getAsString();
        Date dateD = new Date();
        try {
            dateD = new SimpleDateFormat("yyyy-MM-dd HH:mm:ss").parse(date);
        } catch (ParseException e) {
            // TODO Auto-generated catch block
            e.printStackTrace();
        }
        date = new SimpleDateFormat("yyyy-MM-dd").format(dateD);


        ClassService service=new ClassService();

        JsonArray paramzObjectatc = paramzObject.getAsJsonArray("areaTree");
        //JsonArray paramzObjectatc = paramzObjectat.getAsJsonArray("name");
        for (int j = 0; j < paramzObjectatc.size(); j++)
        {
            JsonObject sonObjectj = (JsonObject) paramzObjectatc.get(j);
            String countryname = sonObjectj.get("name").getAsString();
            if(!countryname.equals("中国"))
                continue;
            JsonArray feedsArray = sonObjectj.getAsJsonArray("children");
            for (int i = 0; i < feedsArray.size(); i++)
            {
                JsonObject sonObject = (JsonObject) feedsArray.get(i);
                String name = sonObject.get("name").getAsString();
                JsonObject today = sonObject.getAsJsonObject("today");
                JsonObject total = sonObject.getAsJsonObject("total");

                String today_confirm = today.get("confirm").getAsString();
                String today_suspect =today.get("suspect").getAsString();
                String today_dead =today.get("dead").getAsString();
                String today_heal =today.get("heal").getAsString();


                String total_confirm = total.get("confirm").getAsString();
                String total_suspect =total.get("suspect").getAsString();
                String total_dead =total.get("dead").getAsString();
                String total_heal =total.get("heal").getAsString();
                service.add("yiqinprovince", new String[] {"province","today_confirm","today_suspect","today_dead","today_heal","total_confirm","total_suspect","total_dead","total_heal","date"},new String[]{name,today_confirm,today_suspect,today_dead,today_heal,total_confirm,total_suspect,total_dead,total_heal,date});


                JsonArray cityArray = sonObject.getAsJsonArray("children");
                for(int z=0;z<cityArray.size();z++)
                {
                    JsonObject city=(JsonObject) cityArray.get(z);
                    String cityname = city.get("name").getAsString();
                    JsonObject ctoday = city.getAsJsonObject("today");
                    JsonObject ctotal = city.getAsJsonObject("total");

                    String ctoday_confirm = ctoday.get("confirm").getAsString();
                    String ctoday_suspect =ctoday.get("suspect").getAsString();
                    String ctoday_dead =ctoday.get("dead").getAsString();
                    String ctoday_heal =ctoday.get("heal").getAsString();


                    String ctotal_confirm = ctotal.get("confirm").getAsString();
                    String ctotal_suspect =ctotal.get("suspect").getAsString();
                    String ctotal_dead =ctotal.get("dead").getAsString();
                    String ctotal_heal =ctotal.get("heal").getAsString();

                    service.add("yiqin", new String[] {"province","city","today_confirm","today_suspect","today_dead","today_heal","total_confirm","total_suspect","total_dead","total_heal","date"},new String[]{name,cityname,ctoday_confirm,ctoday_suspect,ctoday_dead,ctoday_heal,ctotal_confirm,ctotal_suspect,ctotal_dead,ctotal_heal,date});
                }
            }
        }
    }


    public static String getURLInfo(String urlInfo,String charset){
        //读取目的网页URL地址,获取网页源码
        URL url=null;
        StringBuilder sb=null;
        try {
            url = new URL(urlInfo);
            HttpURLConnection httpUrl = (HttpURLConnection)url.openConnection();
            InputStream is = httpUrl.getInputStream();
            BufferedReader br = new BufferedReader(new InputStreamReader(is,charset));
             sb = new StringBuilder();
            String line;
            while ((line = br.readLine()) != null) {
                //这里是对链接进行处理
                //line = line.replaceAll("</?a[^>]*>", "");
                //这里是对样式进行处理
                //line = line.replaceAll("<(\\w+)[^>]*>", "<$1>");
                sb.append(line);
            }
            is.close();
            br.close();
            //获得网页源码
        } catch ( IOException e) {
            // TODO 自动生成的 catch 块
            e.printStackTrace();
        }

        return sb.toString().trim();
    }
}
Eharts网页的代码如下:
<!DOCTYPE html>
<html>
<head>
<%@ page language="java" contentType="text/html; charset=UTF-8"
    pageEncoding="UTF-8"%>
<%@ page language="java" import="java.util.*"%>
<%@ page language="java" import="type.*"%>
<meta http-equiv="Content-Type" content="text/html; charset=UTF-8">
    <title>ECharts</title>
    <!-- 引入 echarts.js -->
    <script src="echarts2/echarts-all.js"></script>
    <style>
        *{
            margin: 0;
            padding: 0;
        }
        .echarts{
            width:100%;
            height: 100%;
            position: absolute;
        }

</style>
</head>
<body>
    <!-- 为ECharts准备一个具备大小(宽高)的Dom -->
    <div id="main" style="width: 100%;height:100%;" class="echarts"></div>
    <script type="text/javascript">
        // 基于准备好的dom,初始化echarts实例
        <% ClassService service=new ClassService();
        List<List<String>> yiqin=service.list("yiqin");
        List<List<String>> yiqinprovince=service.list("yiqinprovince");
        %>
        var myChart = echarts.init(document.getElementById('main'));
        var option=null;
        // 指定图表的配置项和数据
        var ecConfig = echarts.config;
        var zrEvent = zrender.tool.event;
        var curIndx = 0;
        var mapType = [
            'china',
            // 23个省
            '广东', '青海', '四川', '海南', '陕西',
            '甘肃', '云南', '湖南', '湖北', '黑龙江',
            '贵州', '山东', '江西', '河南', '河北',
            '山西', '安徽', '福建', '浙江', '江苏',
            '吉林', '辽宁', '台湾',
            // 5个自治区
            '新疆', '广西', '宁夏', '内蒙古', '西藏',
            // 4个直辖市
            '北京', '天津', '上海', '重庆',
            // 2个特别行政区
            '香港', '澳门'
        ];
        document.getElementById('main').onmousewheel = function (e){
            var event = e || window.event;
            curIndx += zrEvent.getDelta(event) > 0 ? (-1) : 1;
            if (curIndx < 0) {
                curIndx = mapType.length - 1;
            }
            var mt = mapType[curIndx % mapType.length];
            if (mt == 'china') {
                option.tooltip.formatter = '滚轮切换或点击进入该省<br/>{b}';
            }
            else{
                option.tooltip.formatter = '滚轮切换省份或点击返回全国<br/>{b}';
            }
            option.series[0].mapType = mt;
            option.title.subtext = mt + ' (滚轮或点击切换)';
            myChart.setOption(option, true);

            zrEvent.stop(event);
        };
        myChart.on(ecConfig.EVENT.MAP_SELECTED, function (param){
            var len = mapType.length;
            var mt = mapType[curIndx % len];
            if (mt == 'china') {
                // 全国选择时指定到选中的省份
                var selected = param.selected;
                for (var i in selected) {
                    if (selected[i]) {
                        mt = i;
                        while (len--) {
                            if (mapType[len] == mt) {
                                curIndx = len;
                            }
                        }
                        break;
                    }
                }
                option.tooltip.formatter = '滚轮切换省份或点击返回全国<br/>{b}';
                option.dataRange.max=10;
            }
            else {
                curIndx = 0;
                mt = 'china';
                option.tooltip.formatter = '滚轮切换或点击进入该省<br/>{b}';
                option.dataRange.max=2000;
            }
            option.series[0].mapType = mt;
            option.title.subtext = mt + ' (滚轮或点击切换)';
            myChart.setOption(option, true);
        });

        option = {
            title: {
                text : '全国34个省市自治区',
                subtext : 'china (滚轮或点击切换)'
            },
            tooltip : {
                trigger: 'item',
                formatter: '滚轮切换或点击进入该省<br/>{b}'
            },
            legend: {
                orient: 'vertical',
                x:'right',
                data:['疫情地图','全国地图'],
                selectedMode: 'single',
                selected:{
                    '全国地图':false
                }
            },
            dataRange: {
                min: 0,
                max: 2000,
                color:['red','orange','yellow','lightgreen'],
                text:['严重','正常'],           // 文本,默认为数值文本
                calculable : true
            },
            series : [
                {
                    name: '疫情地图',
                    type: 'map',
                    mapType: 'china',
                    selectedMode : 'single',
                    itemStyle:{
                        normal:{label:{show:true}},
                        emphasis:{label:{show:true}}
                    },
                    data:[
                        <%for(int i=0;i<yiqin.size();i++){%>
                        {name: '<%=yiqin.get(i).get(1)+"市"%>',value:<%=yiqin.get(i).get(2)%>},
                        {name: '<%=yiqin.get(i).get(1)+"自治州"%>',value:<%=yiqin.get(i).get(2)%>},
                        {name: '<%=yiqin.get(i).get(1)+"地区"%>',value:<%=yiqin.get(i).get(2)%>},
                        {name: '<%=yiqin.get(i).get(1)+"林区"%>',value:<%=yiqin.get(i).get(2)%>},
                        {name: '<%=yiqin.get(i).get(1)+"区"%>',value:<%=yiqin.get(i).get(2)%>},
                        {name: '<%=yiqin.get(i).get(1)%>',value:<%=yiqin.get(i).get(2)%>},
                        <%}%>
                        <%for(int i1=0;i1<yiqinprovince.size();i1++){%>
                        {name: '<%=yiqinprovince.get(i1).get(0)%>',value:<%=yiqinprovince.get(i1).get(1)%>}
                        <%if(i1!=yiqinprovince.size()-1){%>
                                        ,
                        <%}
                        }%>

                    ]
                },
                {
                    name: '全国地图',
                    type: 'map',
                    mapType: 'china',
                    selectedMode : 'single',
                    itemStyle:{
                        normal:{label:{show:true}},
                        emphasis:{label:{show:true}}
                    },
                    data:[


                    ]
                }
            ]
        };


        // 使用刚指定的配置项和数据显示图表。
        myChart.setOption(option);
    </script>
</body>
</html>
此次实验截图:


来源:https://www.cnblogs.com/halone/p/12292490.html