问题
I managed connect the end points in the normal polarPlot like
data([1:end 1],1)
but doing interpolation does not interpolate the extended path
data = load('rem_angle_2.dat');
n = 30; phi = interp(data([1:end 1],1)*pi/180, n); H = interp(data([1:end 1], 3), n);
mu = 4 * 3.14e-7; ms = 1.2e6; K = 4.5e4; h = mu .* ms .* H / (2 .* K);
cosphi = h .* abs(cos( phi )) + (cos( phi ) ) .^2;
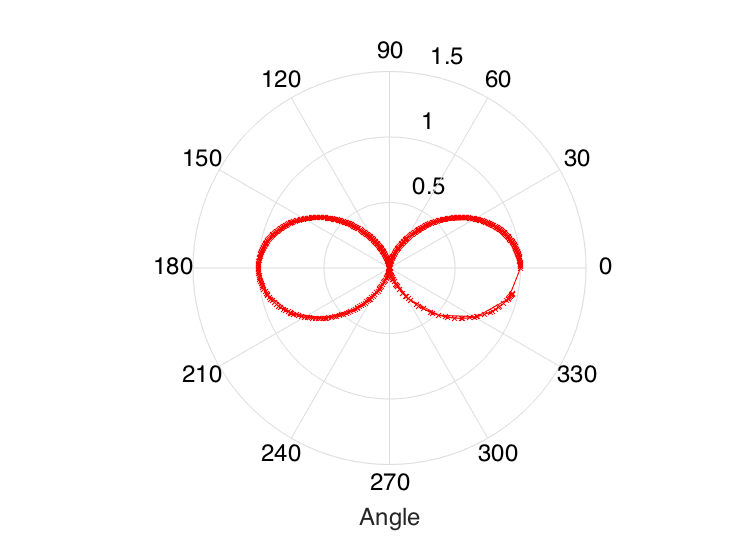
polar(phi, cosphi, 'r-x');
Example output in the red circle
Data
0   0.0314410000000000  0.940571096308908
15  0.0349230000000000  0.969954146597296
30  0.0313780000000000  0.839337718198396
45  0.0248700000000000  0.745214472624085
60  0.0231580000000000  0.478142525177060
75  0.0199550000000000  0.296548109978132
90  0.0270400000000000  0.155780680534267
105 0.0203080000000000  0.344801658689296
120 0.0254600000000000  0.592786274973634
135 0.0290010000000000  0.754378087574740
150 0.0238800000000000  0.834979038161321
165 0.0208110000000000  1.07503919352428
180 0.0312170000000000  0.950446840529786
210 0.0270380000000000  0.825443882649447
240 0.0321900000000000  0.588919403368673
270 0.0312300000000000  0.0490005355090298
300 0.0243250000000000  0.486928993377883
330 0.0257870000000000  0.846981230530059
How can you interpolate the end parts too in Matlab?
回答1:
The function interp1 is what you should look into, if you want to do linear interpolation.
n = 100;
phi = linspace(0, 2*pi, n);
H = interp1([data(:,1); 360+data(1,1)]*pi/180, ...
             data([1:end 1],3), ...
             phi);
Bare in mind that linear interpolation in polar coordinates is something different than linear interpolation of the corresponding cartesian coordinates! (Notice how round the plot becomes for large n.)
来源:https://stackoverflow.com/questions/29548121/interpolating-the-end-points-in-matlabs-polarplot