My problem is drawing a plot atop an image. The image is not just meant to be a nice background but should line up with the plot.
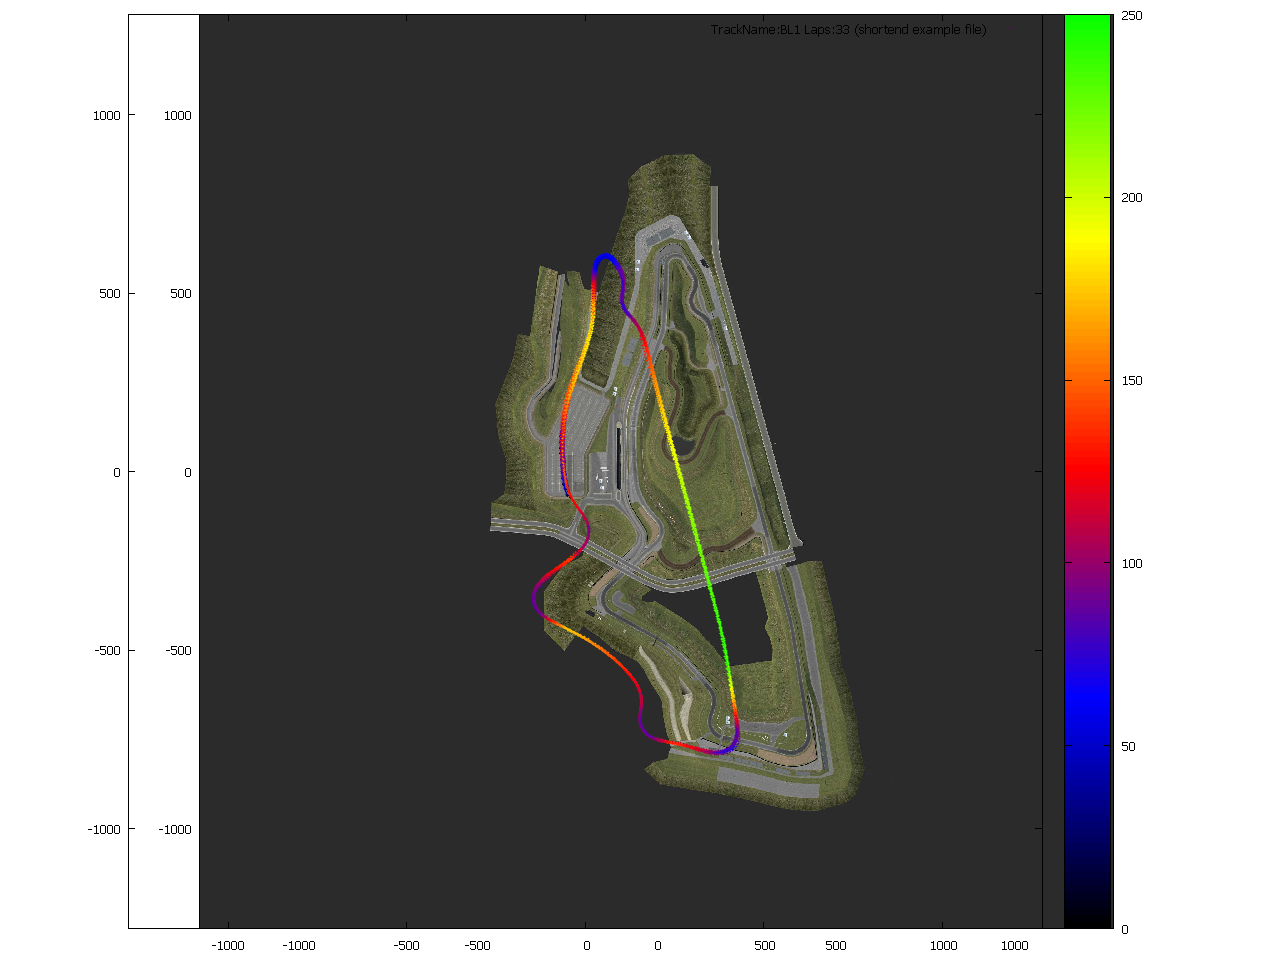
The plot is many colored points representing a car's speed and position in a coordinates system. That works.
Now I want to line up the plot with an image of the road and there I have problems.
The data file looks like this:
-60.2501 106.115 0 0
-68.1729 98.0388 0 0
[...]
x-pos, y-pos,speed, ignore last number
Here is what I have so far:
set multiplot

set yrange [-1280:1280]
set xrange [-1280:1280]
# set xrange [-1470:1280]

set size ratio 1
plot 'BL.jpg' binary filetype=jpg origin = (-1280,-1280) with rgbimage

set origin 0, 0
set size ratio 1

set yrange [-1280:1280]
set xrange [-1280:1280]
set key autotitle columnhead
set palette defined (0 "black", 0.25 "blue", 0.5 "red", 0.75 "yellow", 1 "green")
plot 'output.txt' using 1:2:3 with points palette pt 6 ps 0.1

unset multiplot
Sadly along the x-axis it is not lined up:
http://www.abload.de/img/doesnotlineuposs6n.png (1280 x 960 Pixels, 311KB)
By adjusting some numbers I can kind of line it up but that is just random guessing.
I tried adding this after the set multiplot :
set lmargin at screen 0.1
set rmargin at screen 0.98
set tmargin at screen 0.98
set bmargin at screen 0.2
which results in a bit better fit but now the scale is wrong?

Also the road image disappears when zooming in by selecting a rectangle with RMB?
link to example data file and track image: http://pastebin.com/e5Yy5BaZ (sorry, the site does not allow me to post more than 2 links (need 10 reputation))
You don't need to use multiplot for this, just plot the two files with a single plot command (Thanks for the hint :)):
reset
set size ratio 1
set autoscale fix
set key above autotitle columnhead
set palette defined (0 "black", 0.25 "blue", 0.5 "red", 0.75 "yellow", 1 "green")
plot 'BL.jpg' binary filetype=jpg center=(0,0) with rgbimage notitle,\
     'output.txt' using 1:2:3 with points palette pt 6 ps 0.1 title columnheader(1)
This gives:

Notes:
set autoscale fixuses tight ranges (forx,yandcb), without expanding to the next tic.Using
center=(0,0)removes the last explicit dependency on the exact image dimensions
来源:https://stackoverflow.com/questions/18738752/gnuplot-plot-in-correct-scale-position-on-top-of-image