一.k均值聚类算法
对于样本集 。"k均值"算法就是针对聚类划分
 最小化平方误差:
其中 是簇Ci的均值向量。从上述公式中可以看出,该公式刻画了簇内样本围绕簇均值向量的紧密程度,E值越小簇内样本的相似度越高。
工作流程:

k-均值算法的描述如下:
创建k个点作为起始质心(通常随机选择)
当任意一个点的簇分配结果发生改变时:
        对数据集中的每个点:
                对每个质心:
                计算质心与数据点之间的距离
         将数据点分配到距离其最近的簇
对每一个簇,计算簇中所有点的均值并将均值作为质心
接下来是对于数据集testSet.txt的代码实现:
1.658985	4.285136
-3.453687	3.424321
4.838138	-1.151539
-5.379713	-3.362104
0.972564	2.924086
-3.567919	1.531611
0.450614	-3.302219
-3.487105	-1.724432
2.668759	1.594842
-3.156485	3.191137
3.165506	-3.999838
-2.786837	-3.099354
4.208187	2.984927
-2.123337	2.943366
0.704199	-0.479481
-0.392370	-3.963704
2.831667	1.574018
-0.790153	3.343144
2.943496	-3.357075
-3.195883	-2.283926
2.336445	2.875106
-1.786345	2.554248
2.190101	-1.906020
-3.403367	-2.778288
1.778124	3.880832
-1.688346	2.230267
2.592976	-2.054368
-4.007257	-3.207066
2.257734	3.387564
-2.679011	0.785119
0.939512	-4.023563
-3.674424	-2.261084
2.046259	2.735279
-3.189470	1.780269
4.372646	-0.822248
-2.579316	-3.497576
1.889034	5.190400
-0.798747	2.185588
2.836520	-2.658556
-3.837877	-3.253815
2.096701	3.886007
-2.709034	2.923887
3.367037	-3.184789
-2.121479	-4.232586
2.329546	3.179764
-3.284816	3.273099
3.091414	-3.815232
-3.762093	-2.432191
3.542056	2.778832
-1.736822	4.241041
2.127073	-2.983680
-4.323818	-3.938116
3.792121	5.135768
-4.786473	3.358547
2.624081	-3.260715
-4.009299	-2.978115
2.493525	1.963710
-2.513661	2.642162
1.864375	-3.176309
-3.171184	-3.572452
2.894220	2.489128
-2.562539	2.884438
3.491078	-3.947487
-2.565729	-2.012114
3.332948	3.983102
-1.616805	3.573188
2.280615	-2.559444
-2.651229	-3.103198
2.321395	3.154987
-1.685703	2.939697
3.031012	-3.620252
-4.599622	-2.185829
4.196223	1.126677
-2.133863	3.093686
4.668892	-2.562705
-2.793241	-2.149706
2.884105	3.043438
-2.967647	2.848696
from numpy import *

#load data
def loadDataSet(fileName):
    dataMat = []
    fr = open(fileName)
    for line in fr.readlines(): #for each line
        curLine = line.strip().split('\t')
        fltLine = list(map(float,curLine)) #这里和书中不同 和上一章一样修改
        dataMat.append(fltLine)
    return dataMat

#distance func
def distEclud(vecA,vecB):
    return sqrt(sum(power(vecA - vecB, 2)))  # la.norm(vecA-vecB) 向量AB的欧式距离

#init K points randomly
def randCent(dataSet, k):
    n = shape(dataSet)[1]
    centroids = mat(zeros((k,n)))#create centroid mat
    for j in range(n):#create random cluster centers, within bounds of each dimension
        minJ = min(dataSet[:,j])
        rangeJ = float(max(dataSet[:,j]) - minJ)
        centroids[:,j] = mat(minJ + rangeJ * random.rand(k,1))
    return centroids
计算出矩阵中的最大值、最小值、距离:
>>> import mykmeans
>>> from numpy import *
>>> datMat=mat(mykmeans.loadDataSet('testSet.txt'))
>>> min(datMat[:,0])
matrix([[-5.379713]])
>>> min(datMat[:,1])
matrix([[-4.232586]])
>>> max(datMat[:,0])
matrix([[4.838138]])
>>> max(datMat[:,1])
matrix([[5.1904]])
>>> mykmeans.randCent(datMat,2)
matrix([[ 0.94526572, -2.73986112],
        [-1.56707725,  4.14438101]])
>>> mykmeans.distEclud(datMat[0],datMat[1])
5.184632816681332
接下来是K-均值算法的核心程序:
def kMeans(dataSet, k, distMeas=distEclud, createCent=randCent):
    m = shape(dataSet)[0]
    clusterAssment = mat(zeros((m,2)))#create mat to assign data points
                                      #to a centroid, also holds SE of each point
    centroids = createCent(dataSet, k)
    clusterChanged = True
    while clusterChanged:
        clusterChanged = False
        for i in range(m):#for each data point assign it to the closest centroid
            minDist = inf; minIndex = -1
            for j in range(k):
                distJI = distMeas(centroids[j,:],dataSet[i,:])
                if distJI < minDist:
                    minDist = distJI; minIndex = j
            if clusterAssment[i,0] != minIndex: clusterChanged = True
            clusterAssment[i,:] = minIndex,minDist**2
        print (centroids)
        for cent in range(k):#recalculate centroids
            ptsInClust = dataSet[nonzero(clusterAssment[:,0].A==cent)[0]]#get all the point in this cluster
            centroids[cent,:] = mean(ptsInClust, axis=0) #assign centroid to mean
    return centroids, clusterAssment

datMat=mat(loadDataSet('testSet.txt'))
myCentroids,clustAssing=kMeans(datMat,4)
取k为4,得到4个质心:
[[ 4.80480327  0.7928886 ]
 [ 1.2776812  -3.82602902]
 [ 2.56286444  4.00821365]
 [-1.43428372  3.0160483 ]]
[[ 4.007951   -0.28653243]
 [-0.64297274 -3.04016156]
 [ 2.51964406  3.40459212]
 [-2.605345    2.35623864]]
[[ 3.4363324  -2.41850987]
 [-2.26682904 -2.92971896]
 [ 2.54391447  3.21299611]
 [-2.46154315  2.78737555]]
[[ 2.926737   -2.70147753]
 [-3.19984738 -2.96423548]
 [ 2.6265299   3.10868015]
 [-2.46154315  2.78737555]]
[[ 2.80293085 -2.7315146 ]
 [-3.38237045 -2.9473363 ]
 [ 2.6265299   3.10868015]
 [-2.46154315  2.78737555]]
二.后处理提高聚类性能

聚类算法中,k的值是由用户初始定义的,如何才能判断k值定义是否合适,就需要用误差来评价聚类效果的好坏,误差是各个点与其所属类别质心的距离决定的。K-均值聚类的方法效果较差的原因是会收敛到局部最小值,而且全局最小。一种评价聚类效果的方法是SSE(Sum of Squared Error)误差平方和的方法,取平方的结果是使得远离中心的点变得更加突出。
一种降低SSE的方法是增加簇的个数,即提高k值,但是违背了聚类的目标,聚类的目标是在不改变簇数目的前提下提高簇的质量。可选的改进的方法是对生成的簇进行后处理,将最大SSE值的簇划分成两个(K=2的K-均值算法),然后再进行相邻的簇合并。具体方法有两种:1、合并最近的两个质心(合并使得SSE增幅最小的两个质心)2、遍历簇 合并两个然后计算SSE的值,找到使得SSE最小的情况。
三.二分K-均值算法

这个算法的思想是:初始状态所有数据点属于一个大簇,之后每次选择一个簇切分成两个簇,这个切分满足使SSE值最大程度降低,直到簇数目达到k。另一种思路是每次选择SSE值最大的一个簇进行切分。
满足使SSE值最大程度降低伪代码如下:
将所有点看成一个簇
   当簇数目小于k时
        对于每一个簇:
            计算总误差
            在给定的簇上面进行K-均值聚类(k=2)
    计算将该簇一分为二后的总误差
    选择使得误差最小的那个簇进行划分操作
代码如下:
def biKmeans(dataSet,k,distMeas=distEclud):
    m=shape(dataSet)[0]
    clusterAssment=mat(zeros((m,2)))
    centroid0 = mean(dataSet, axis=0).tolist()[0]
    centList = [centroid0]  # create a list with one centroid
    for j in range(m):  # calc initial Error for each point
        clusterAssment[j, 1] = distMeas(mat(centroid0), dataSet[j, :]) ** 2
    while (len(centList) < k):
        lowestSSE = inf #init SSE
        for i in range(len(centList)):#for every centroid
            ptsInCurrCluster = dataSet[nonzero(clusterAssment[:, 0].A == i)[0],:]  # get the data points currently in cluster i
            centroidMat, splitClustAss = kMeans(ptsInCurrCluster, 2, distMeas)# k=2,kMeans
            sseSplit = sum(splitClustAss[:, 1])  # compare the SSE to the currrent minimum
            sseNotSplit = sum(clusterAssment[nonzero(clusterAssment[:, 0].A != i)[0], 1])
            print("sseSplit, and notSplit: ", sseSplit, sseNotSplit)
            if (sseSplit + sseNotSplit) < lowestSSE: #judge the error
                bestCentToSplit = i
                bestNewCents = centroidMat
                bestClustAss = splitClustAss.copy()
                lowestSSE = sseSplit + sseNotSplit
        #new cluster and split cluster
        bestClustAss[nonzero(bestClustAss[:, 0].A == 1)[0], 0] = len(centList)  # change 1 to 3,4, or whatever
        bestClustAss[nonzero(bestClustAss[:, 0].A == 0)[0], 0] = bestCentToSplit
        print('the bestCentToSplit is: ', bestCentToSplit)
        print('the len of bestClustAss is: ', len(bestClustAss))
        centList[bestCentToSplit] = bestNewCents[0, :].tolist()[0]  # replace a centroid with two best centroids
        centList.append(bestNewCents[1, :].tolist()[0])
        clusterAssment[nonzero(clusterAssment[:, 0].A == bestCentToSplit)[0],:] = bestClustAss  # reassign new clusters, and SSE
    return mat(centList), clusterAssment

datMat3=mat(loadDataSet('testSet2.txt'))
centList,myNewAssments=biKmeans(datMat3,3)
centList
运行结果:
[[4.22282288 2.88343006]
 [0.53706656 4.28802843]]
[[ 2.37096343  0.78503778]
 [-1.72960876  1.49902535]]
[[ 2.22969593  1.291217  ]
 [-2.24671409  1.16767909]]
[[ 2.40575527  1.66726781]
 [-2.11802947  0.88737776]]
[[ 2.93386365  3.12782785]
 [-1.70351595  0.27408125]]
sseSplit, and notSplit:  541.2976292649145 0.0
the bestCentToSplit is:  0
the len of bestClustAss is:  60
[[2.17022341 1.96268662]
 [3.12589387 4.12081081]]
[[2.38650938 2.40163825]
 [3.2987665  3.61195425]]
[[2.32716778 2.52893967]
 [3.43025118 3.61782727]]
sseSplit, and notSplit:  27.63707606832937 501.7683305828214
[[-2.80259011  4.25652642]
 [-0.51490661  3.66748635]]
[[-3.14707283  3.35698672]
 [-0.52242395 -2.24829595]]
[[-2.94737575  3.3263781 ]
 [-0.45965615 -2.7782156 ]]
sseSplit, and notSplit:  67.2202000797829 39.52929868209309
the bestCentToSplit is:  1
the len of bestClustAss is:  40
四.应用:对地图上的点进行聚类
portlandClubs.txt
Dolphin II    10860 SW Beaverton-Hillsdale Hwy    Beaverton, OR
Hotties    10140 SW Canyon Rd.    Beaverton, OR
Pussycats    8666a SW Canyon Road    Beaverton, OR
Stars Cabaret    4570 Lombard Ave    Beaverton, OR
Sunset Strip    10205 SW Park Way    Beaverton, OR
Vegas VIP Room    10018 SW Canyon Rd    Beaverton, OR
Full Moon Bar and Grill    28014 Southeast Wally Road    Boring, OR
505 Club    505 Burnside Rd    Gresham, OR
Dolphin    17180 McLoughlin Blvd    Milwaukie, OR
Dolphin III    13305 SE McLoughlin BLVD    Milwaukie, OR
Acropolis    8325 McLoughlin Blvd    Portland, OR
Blush    5145 SE McLoughlin Blvd    Portland, OR
Boom Boom Room    8345 Barbur Blvd    Portland, OR
Bottoms Up    16900 Saint Helens Rd    Portland, OR
Cabaret II    17544 Stark St    Portland, OR
Cabaret Lounge    503 W Burnside    Portland, OR
Carnaval    330 SW 3rd Avenue    Portland, OR
Casa Diablo    2839 NW St. Helens Road    Portland, OR
Chantilly Lace    6723 Killingsworth St    Portland, OR
Club 205    9939 Stark St    Portland, OR
Club Rouge    403 SW Stark    Portland, OR
Dancin' Bare    8440 Interstate Ave    Portland, OR
Devil's Point    5305 SE Foster Rd    Portland, OR
Double Dribble    13550 Southeast Powell Boulevard    Portland, OR
Dream on Saloon    15920 Stark St    Portland, OR
DV8    5003 Powell Blvd    Portland, OR
Exotica    240 Columbia Blvd    Portland, OR
Frolics    8845 Sandy Blvd    Portland, OR
G-Spot Airport    8654 Sandy Blvd    Portland, OR
G-Spot Northeast    3400 NE 82nd Ave    Portland, OR
G-Spot Southeast    5241 SE 72nd Ave    Portland, OR
Glimmers    3532 Powell Blvd    Portland, OR
Golden Dragon Exotic Club    324 SW 3rd Ave    Portland, OR
Heat    12131 SE Holgate Blvd.    Portland, OR
Honeysuckle's Lingerie    3520 82nd Ave    Portland, OR
Hush Playhouse    13560 Powell Blvd    Portland, OR
JD's Bar & Grill    4523 NE 60th Ave    Portland, OR
Jody's Bar And Grill    12035 Glisan St    Portland, OR
Landing Strip    6210 Columbia Blvd    Portland, OR
Lucky Devil Lounge    633 SE Powell Blvd    Portland, OR
Lure    11051 Barbur Blvd    Portland, OR
Magic Garden    217 4th Ave    Portland, OR
Mary's Club    129 Broadway    Portland, OR
Montego's    15826 SE Division    Portland, OR
Mr. Peeps    709 122nd Ave    Portland, OR
Mynt Gentlemen's Club    3390 NE Sandy Blvd    Portland, OR
Mystic    9950 SE Stark St.    Portland, OR
Nicolai Street Clubhouse    2460 24th Ave    Portland, OR
Oh Zone    6218 Columbia Blvd    Portland, OR
Pallas Club    13639 Powell Blvd    Portland, OR
Pirates Cove    7427 Sandy Blvd    Portland, OR
Private Pleasures    10931 53rd Ave    Portland, OR
Pussycats    3414 Northeast 82nd Avenue    Portland, OR
Riverside Corral    545 Tacoma St    Portland, OR
Rooster's    605 Columbia Blvd    Portland, OR
Rose City Strip    3620 35th Pl    Portland, OR
Safari Show Club    3000 SE Powell Blvd    Portland, OR
Sassy's Bar & Grill    927 Morrison St    Portland, OR
Secret Rendezvous    12503 Division St    Portland, OR
Shimmers    7944 Foster Rd    Portland, OR
Soobie's    333 SE 122nd Ave    Portland, OR
Spyce Gentleman's Club    33 NW 2nd Ave    Portland, OR
Sugar Shack    6732 Killingsworth St    Portland, OR
The Hawthorne Strip    1008 Hawthorne Blvd    Portland, OR
Tommy's Too    10335 Foster Rd    Portland, OR
Union Jacks    938 Burnside St    Portland, OR
Video Visions    6723 Killingsworth St    Portland, OR
Stars Cabaret Bridgeport    17939 SW McEwan Rd    Tigard, OR
Jiggles    7455 SW Nyberg St    Tualatin, OR
首先,我们需要将地址转换为经度和纬度
import urllib
import json
def geoGrab(stAddress, city):
    apiStem = 'http://where.yahooapis.com/geocode?'  #create a dict and constants for the goecoder
    params = {}
    params['flags'] = 'J'#JSON return type
    params['appid'] = 'aaa0VN6k'
    params['location'] = '%s %s' % (stAddress, city)
    url_params = urllib.parse.urlencode(params)
    yahooApi = apiStem + url_params      #print url_params
    print (yahooApi)
    c=urllib.parse.urlopen(yahooApi)
    return json.loads(c.read())

from time import sleep
def massPlaceFind(fileName):
    fw = open('places.txt', 'w')
    for line in open(fileName).readlines():
        line = line.strip()
        lineArr = line.split('\t')
        retDict = geoGrab(lineArr[1], lineArr[2])
        if retDict['ResultSet']['Error'] == 0:
            lat = float(retDict['ResultSet']['Results'][0]['latitude'])
            lng = float(retDict['ResultSet']['Results'][0]['longitude'])
            print ("%s\t%f\t%f" % (lineArr[0], lat, lng))
            fw.write('%s\t%f\t%f\n' % (line, lat, lng))
        else: print ("error fetching")
        sleep(1)
    fw.close()

massPlaceFind('portlandClubs.txt')
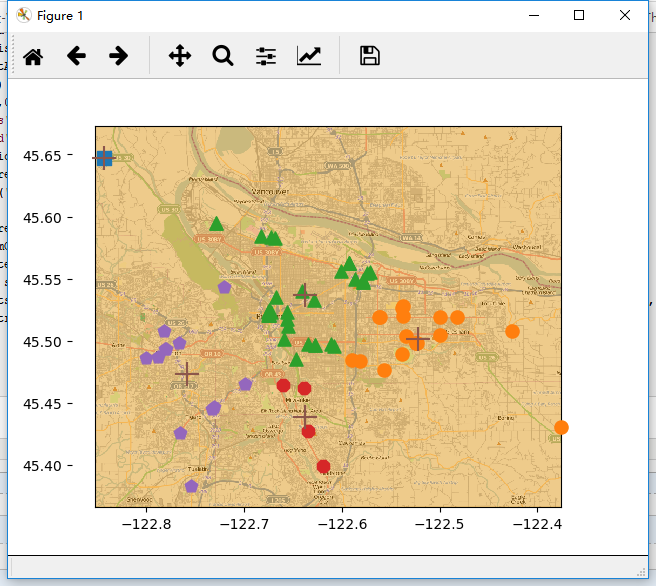
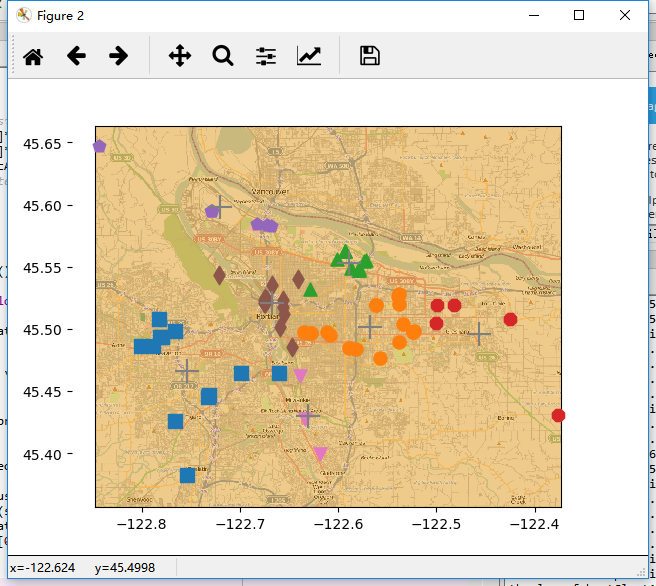
这会在工作目录下生成一个places.txt文本文件,接下来将使用这些点进行聚类,并将俱乐部以及他们的簇中心画在城市地图上。
def distSLC(vecA, vecB):#Spherical Law of Cosines
    a = sin(vecA[0,1]*pi/180) * sin(vecB[0,1]*pi/180)
    b = cos(vecA[0,1]*pi/180) * cos(vecB[0,1]*pi/180) * \
                      cos(pi * (vecB[0,0]-vecA[0,0]) /180)
    return arccos(a + b)*6371.0 #pi is imported with numpy

import matplotlib
import matplotlib.pyplot as plt
def clusterClubs(numClust=5):
    datList = []
    for line in open('places.txt').readlines():
        lineArr = line.split('\t')
        datList.append([float(lineArr[4]), float(lineArr[3])])
    datMat = mat(datList)
    myCentroids, clustAssing = biKmeans(datMat, numClust, distMeas=distSLC)
    fig = plt.figure()
    rect=[0.1,0.1,0.8,0.8]
    scatterMarkers=['s', 'o', '^', '8', 'p', \
                    'd', 'v', 'h', '>', '<']
    axprops = dict(xticks=[], yticks=[])
    ax0=fig.add_axes(rect, label='ax0', **axprops)
    imgP = plt.imread('Portland.png')
    ax0.imshow(imgP)
    ax1=fig.add_axes(rect, label='ax1', frameon=False)
    for i in range(numClust):
        ptsInCurrCluster = datMat[nonzero(clustAssing[:,0].A==i)[0],:]
        markerStyle = scatterMarkers[i % len(scatterMarkers)]
        ax1.scatter(ptsInCurrCluster[:,0].flatten().A[0], ptsInCurrCluster[:,1].flatten().A[0], marker=markerStyle, s=90)
    ax1.scatter(myCentroids[:,0].flatten().A[0], myCentroids[:,1].flatten().A[0], marker='+', s=300)
    plt.show()

clusterClubs(5)
当 将簇的数目改为6时:

当将簇的数目改为7时

参考:https://blog.csdn.net/sinat_17196995/article/details/70332664
https://blog.csdn.net/u013266697/article/details/52832215
来源:oschina
链接:https://my.oschina.net/u/4364952/blog/3948036