1.决策树介绍
决策树利用了树型结构进行决策,是经典的 if-then 结构。叶节点存储类别,内部节点代表特征或属性。

2.决策树使用示例
# -*- coding: utf-8 -*-

#导入numpy
import numpy as np
#导入画图工具
import matplotlib.pyplot as plt

from matplotlib.colors import ListedColormap
#导入tree模型和数据集加载工具
from sklearn import tree,datasets

#导入数据集拆分工具
from sklearn.model_selection import train_test_split

wine = datasets.load_wine()

# 只选取数据集的前两个特征
X = wine.data[:,:2]
y = wine.target
X_train,X_test,y_train,y_test = train_test_split(X,y)
#设定决策树分类器最大深度1
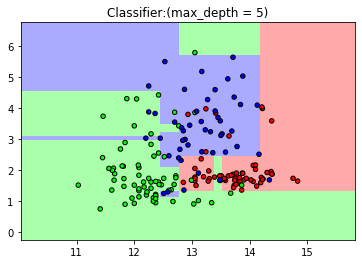
clf = tree.DecisionTreeClassifier(max_depth=5)
clf.fit(X_train,y_train)

#定义图像中分区的颜色和散点的颜色\n
cmap_light = ListedColormap(['#FFAAAA', '#AAFFAA', '#AAAAFF'])
cmap_bold = ListedColormap(['#FF0000', '#00FF00', '#0000FF'])

#分别用样本的两个特征值创建图像和横轴和纵轴
x_min, x_max = X_train[:, 0].min() - 1, X_train[:, 0].max() + 1
y_min, y_max = X_train[:, 1].min() - 1, X_train[:, 1].max() + 1
xx, yy = np.meshgrid(np.arange(x_min, x_max, .02),
                         np.arange(y_min, y_max, .02))
Z = clf.predict(np.c_[xx.ravel(), yy.ravel()])

#给每个分类中的样本分配不同的颜色
Z = Z.reshape(xx.shape)
plt.figure()
plt.pcolormesh(xx, yy, Z, cmap=cmap_light)

#用散点把样本表示出来
plt.scatter(X[:, 0], X[:, 1], c=y, cmap=cmap_bold, edgecolor='k', s=20)
plt.xlim(xx.min(), xx.max())
plt.ylim(yy.min(), yy.max())
plt.title("Classifier:(max_depth = 5)")
plt.show()
来源:oschina
链接:https://my.oschina.net/pengchanghua/blog/3156422