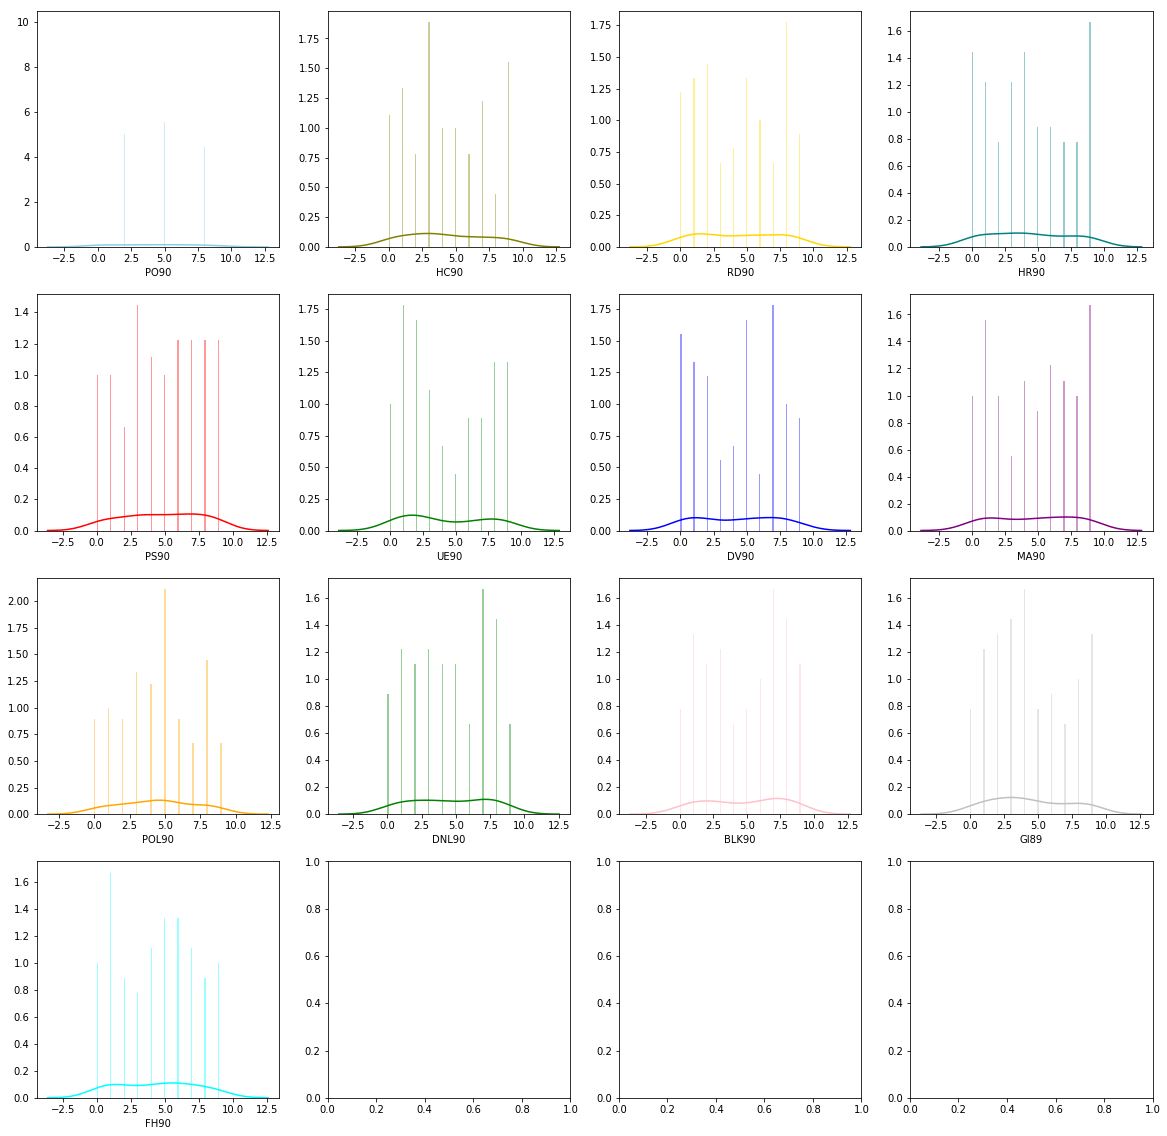
I have a code that create 16 histograms. My problems are:
- I think the code is too much repetative and that there are ways to write it shorter. 2.I have 13 fields to create histograms, and as 13 is prime number, I face a problem how to show all of them nicely but without blank plots.
I want to show the distribution but I get only 1 bar, even though I have change dit to 0, 100 and 500 (I have more than 1000 observations).
some columns are float and have too many 0 after the dot and I can't change it.
This is my code:
f, axes = plt.subplots(4, 4, figsize=(20,20), sharex=True)
sns.distplot(data['HR90'], color="skyblue", ax=axes[0,0],bins=500)
sns.distplot(data['HC90'], color="olive", ax=axes[0,1],bins=100)
sns.distplot(data['RD90'], color="gold", ax=axes[0,2],bins=100)
sns.distplot(data['PO90'], color="teal", ax=axes[0,3], bins=100)

sns.distplot(data['PS90'], color="red", ax=axes[1,0], bins=100)
sns.distplot(data['UE90'], color="green", ax=axes[1,1], bins=100)
sns.distplot(data['DV90'], color="blue", ax=axes[1,2], bins=100)
sns.distplot(data['MA90'], color="purple", ax=axes[1,3], bins=100)

sns.distplot(data['POL90'], color="orange", ax=axes[2,0], bins=100)
sns.distplot(data['DNL90'], color="green", ax=axes[2,1], bins=100)
sns.distplot(data['BLK90'], color="pink", ax=axes[2,2], bins=100)
sns.distplot(data['GI89'], color="silver", ax=axes[2,3], bins=100)

sns.distplot(data['FH90'], color="cyan", ax=axes[3,1], bins=100)
and this is the results:
as you can see I have some empty plots and the bins look like one.
import pandas as pd
import matplotlib.pyplot as plt
import seaborn as sns
import numpy as np

position = []
for x in range(0, 4):
    for y in range (0, 4):
        position.append([x, y])

groups = ['PO90', 'HC90', 'RD90', 'HR90', 'PS90', 'UE90', 'DV90', 'MA90', 'POL90', 'DNL90', 'BLK90', 'GI89','FH90']
graph_colors = ["skyblue", "olive", "gold", "teal", "red", "green", "blue", "purple", "orange", "green", "pink", "silver", "cyan"]
graph_bins = [500, 100, 100, 100, 100, 100, 100, 100, 100, 100, 100, 100, 100]

data = pd.DataFrame(np.random.randint(low=0, high=10, size=(100, 13)), columns=groups)

f, axes = plt.subplots(4, 4, figsize=(20,20), sharex=False, sharey=False)

for i in range(0, 13):
    sns.distplot(data[groups[i]], color=graph_colors[i], ax=axes[position[i][0], position[i][1]], bins=graph_bins[i])
The plot will look like this:
To get rid of the empty plot, sub plots must be added in a slightly different way, like so:
fig = plt.figure(figsize=(20,20))

# Generating 1st column.
for sp_index in range(1, 14, 4):
    ax = fig.add_subplot(4, 4, sp_index)
    sns.distplot(data[groups[sp_index-1]], color=graph_colors[sp_index-1], ax=ax, bins=graph_bins[sp_index-1])

# Generating 2nd column.
for sp_index in range(2, 14, 4):
    ax = fig.add_subplot(4, 4, sp_index)
    sns.distplot(data[groups[sp_index-1]], color=graph_colors[sp_index-1], ax=ax, bins=graph_bins[sp_index-1])

# Generating 3rd column.
for sp_index in range(3, 14, 4):
    ax = fig.add_subplot(4, 4, sp_index)
    sns.distplot(data[groups[sp_index-1]], color=graph_colors[sp_index-1], ax=ax, bins=graph_bins[sp_index-1])

# Generating 4thcolumn.
for sp_index in range(4, 14, 4):
    ax = fig.add_subplot(4, 4, sp_index)
    sns.distplot(data[groups[sp_index-1]], color=graph_colors[sp_index-1], ax=ax, bins=graph_bins[sp_index-1])
Then the plot will look like this (N.B. the graphs will look slightly different to the version above, since the data frame values were generated, using np.random.randint function several times, whilst experimenting with the solution):
I found the solution:
I had to change the sharex and sharey :
f, axes = plt.subplots(4, 4, figsize=(60,60), sharex=False, sharey=False)
This way the don't share the same axes and it works
来源:https://stackoverflow.com/questions/59029227/visualize-histograms-in-seaborn


