
昨天收到了公众号一位读者的邮件,今天的推文回答一下开头提到的问题。还是使用昨天推文的示例数据:3个品种小麦种子的7个不同的指标,这7个指标分别是
-
A 面积 -
B 周长 -
C紧凑度 -
LK 长度 -
WK 宽度 -
A_coef 偏度系数 -
LKG 腹沟长度
使用周长和面积构建拟合方程
首先是读入数据
seed <- read.csv("kaggle/Seed_Data.csv",header=T)
names(seed) <- c("Area", "Perimeter", "Compactness", "Length", "Width", "Asymetry.coef", "Grove.length", "Type")
head(seed)
seed$Type <- as.factor(seed$Type)
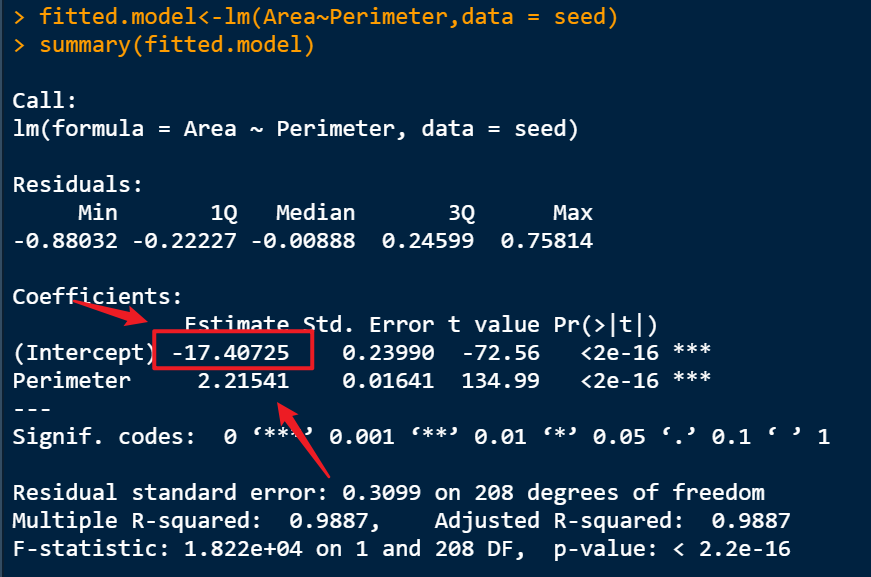
拟合方程
fitted.model<-lm(Area~Perimeter,data = seed)
summary(fitted.model)
接下来是使用ggplot2画图
library(ggplot2)
ggplot()+
  geom_point(data=seed,aes(x=Perimeter,y=Area),
             size=5,color="red",alpha=0.3)+
  geom_abline(intercept = fitted.model$coefficients[[1]],
              slope = fitted.model$coefficients[[2]],
              size=2,color="blue",alpha=0.8)+
  theme_bw()
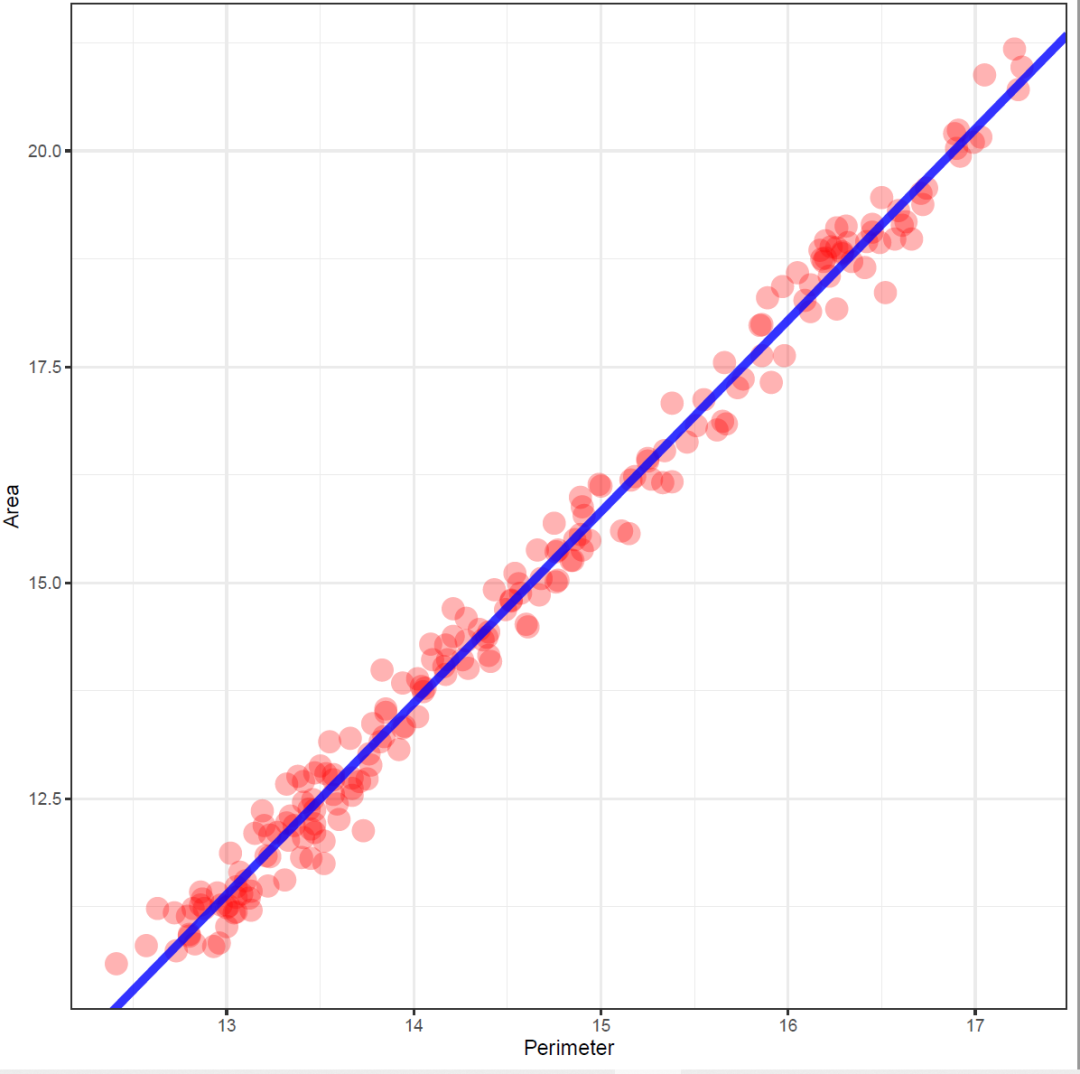
添加你和曲线的函数是
geom_abline(),直接指定斜率slope和截距intercept
接下来是添加辅助线
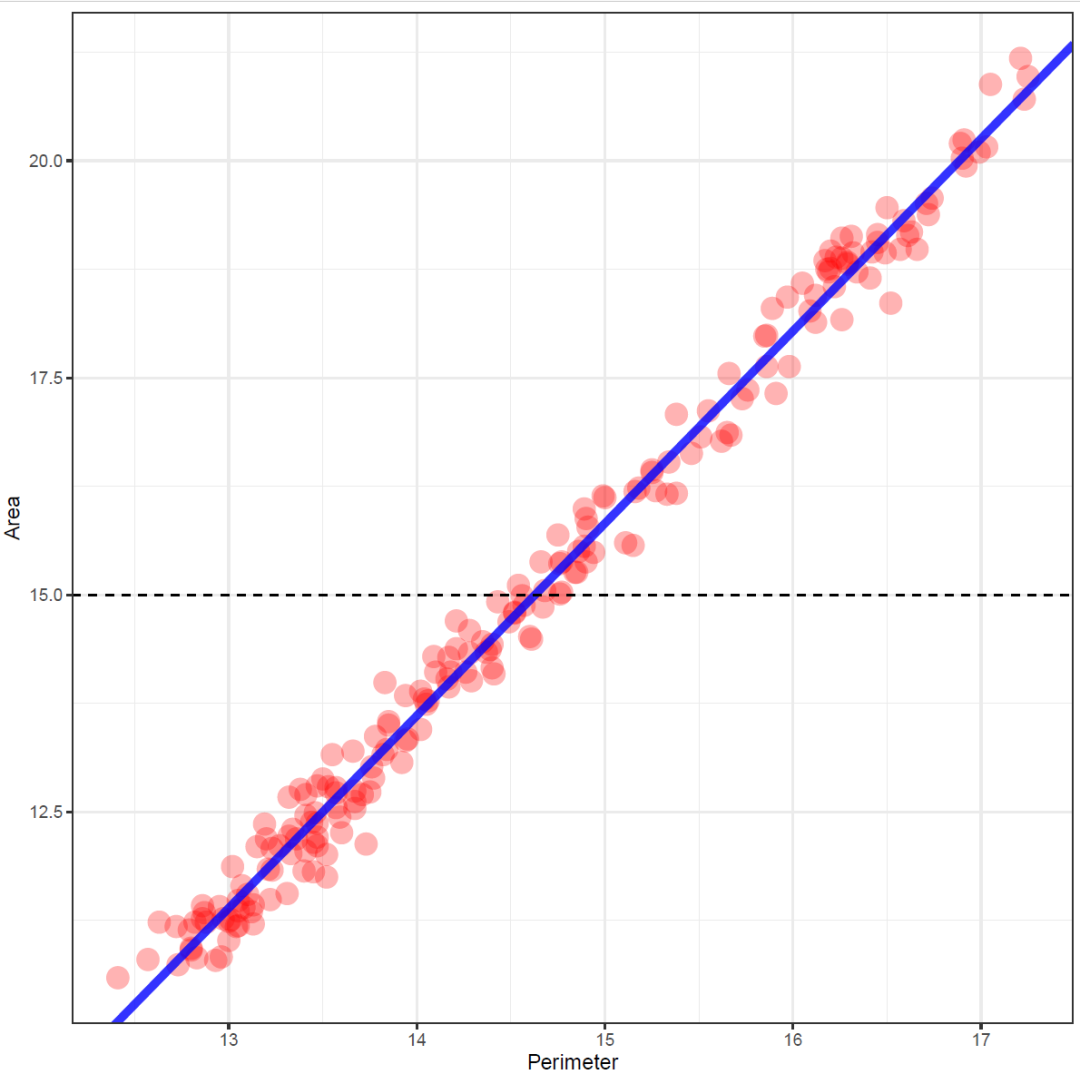
他的问题是拟合曲线和y=1相交,根据我自己的实际数据,比如y=15这里相交,首先在y=15这里添加水平线,使用到的是geom_hline()函数
ggplot()+
  geom_point(data=seed,aes(x=Perimeter,y=Area),
             size=5,color="red",alpha=0.3)+
  geom_abline(intercept = fitted.model$coefficients[[1]],
              slope = fitted.model$coefficients[[2]],
              size=2,color="blue",alpha=0.8)+
  theme_bw()+
  geom_hline(yintercept = 15,lty="dashed")
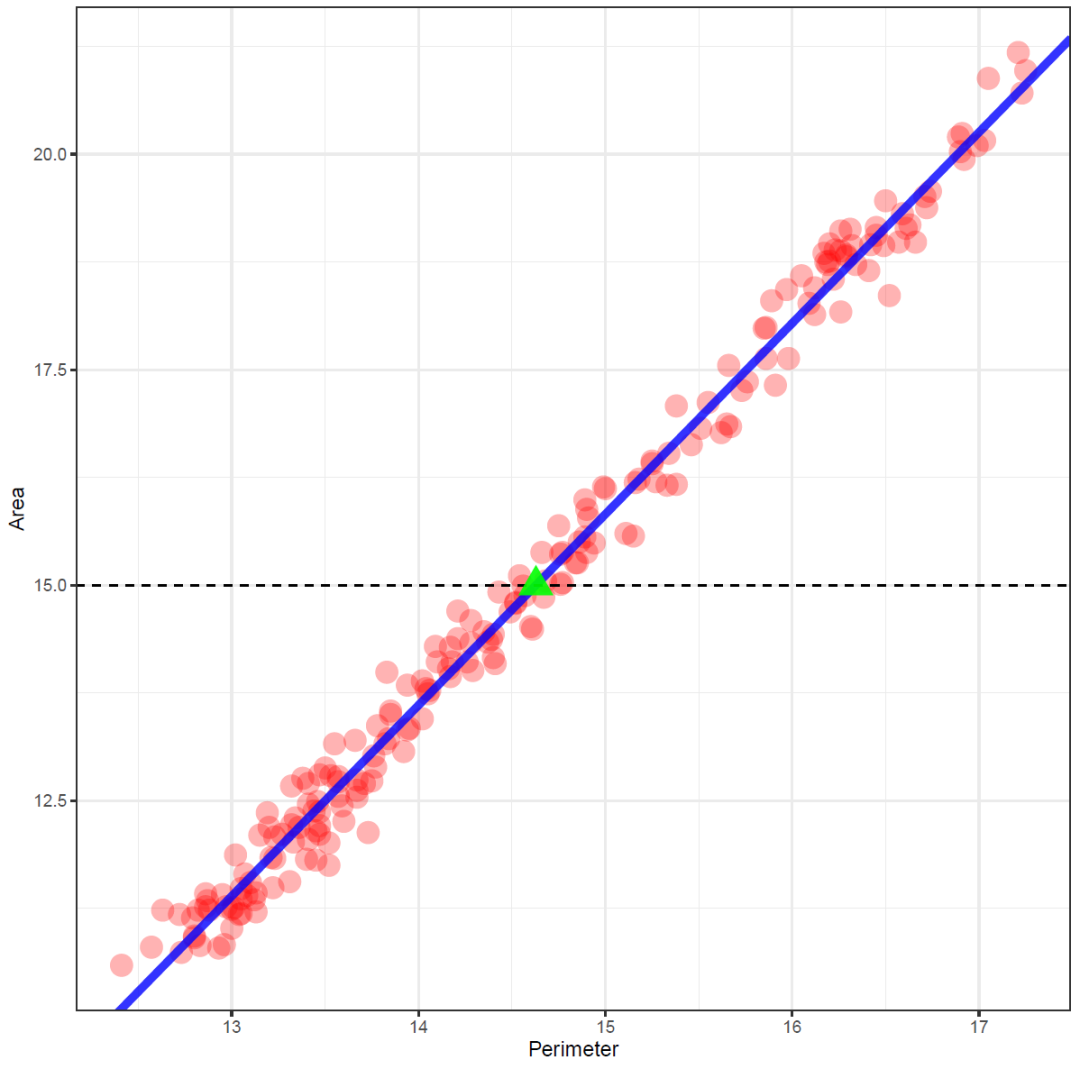
接下来算一下交点位置的坐标
b<-fitted.model$coefficients[[1]]
a<-fitted.model$coefficients[[2]]

fitted.curve<-function(y){
  return((y-b)/a)
}
fitted.curve(15)
在这个交点添加一个点
ggplot()+
  geom_point(data=seed,aes(x=Perimeter,y=Area),
             size=5,color="red",alpha=0.3)+
  geom_abline(intercept = fitted.model$coefficients[[1]],
              slope = fitted.model$coefficients[[2]],
              size=2,color="blue",alpha=0.8)+
  theme_bw()+
  geom_hline(yintercept = 15,lty="dashed")+
  geom_point(aes(x=fitted.curve(15),y=15),size=6,shape=17,
             color="green",alpha=0.9)
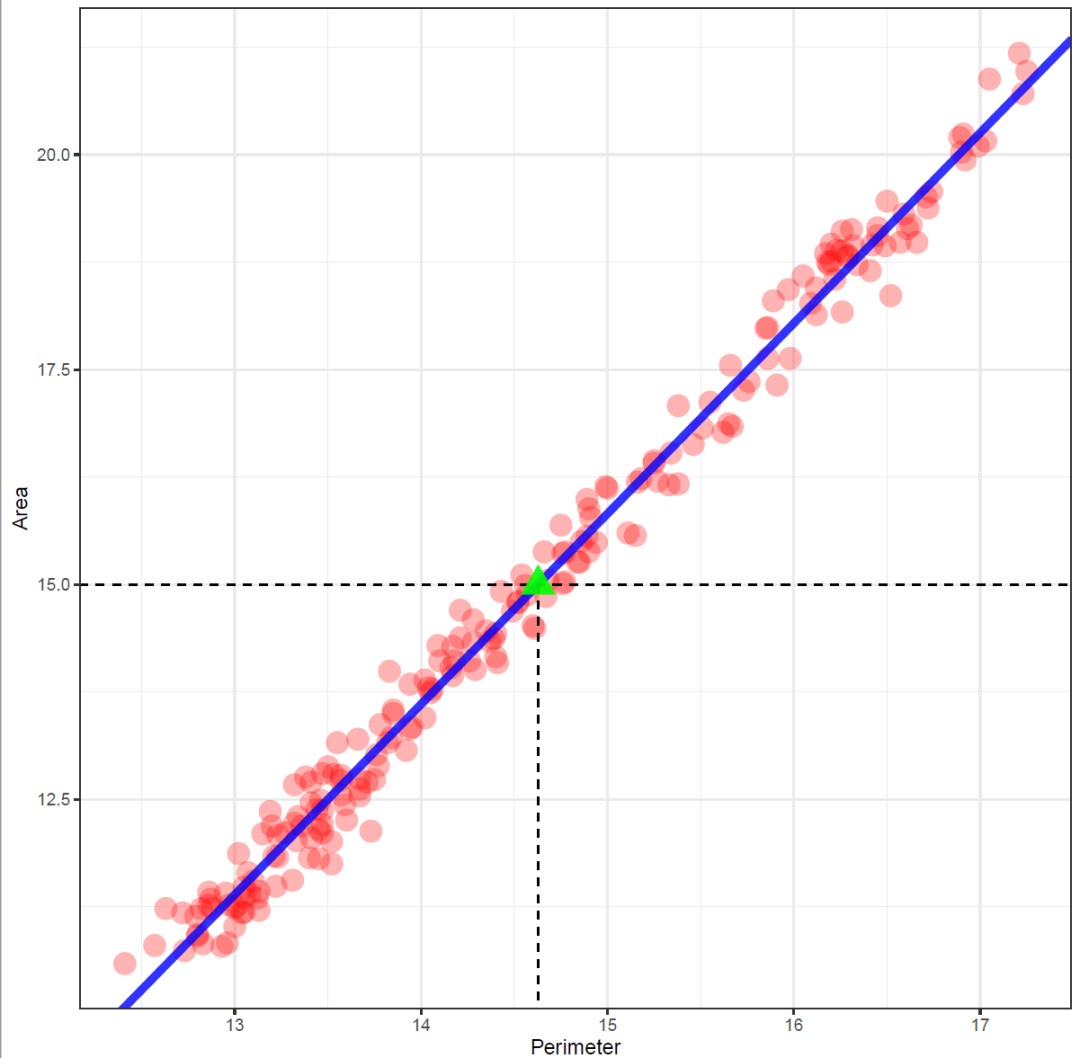
在交点位置向下添加垂直线段
ggplot()+
  geom_point(data=seed,aes(x=Perimeter,y=Area),
             size=5,color="red",alpha=0.3)+
  geom_abline(intercept = fitted.model$coefficients[[1]],
              slope = fitted.model$coefficients[[2]],
              size=2,color="blue",alpha=0.8)+
  theme_bw()+
  geom_hline(yintercept = 15,lty="dashed")+
  annotate(geom = "segment",x=fitted.curve(15),
           xend = fitted.curve(15),y=15,yend = -Inf,
           lty="dashed")+
  geom_point(aes(x=fitted.curve(15),y=15),size=6,shape=17,
             color="green",alpha=0.9)
在X轴与垂直线段的交点处添加文字
ggplot()+
  geom_point(data=seed,aes(x=Perimeter,y=Area),
             size=5,color="red",alpha=0.3)+
  geom_abline(intercept = fitted.model$coefficients[[1]],
              slope = fitted.model$coefficients[[2]],
              size=2,color="blue",alpha=0.8)+
  theme_bw()+
  geom_hline(yintercept = 15,lty="dashed")+
  annotate(geom = "segment",x=fitted.curve(15),
           xend = fitted.curve(15),y=15,yend = -Inf,
           lty="dashed")+
  geom_point(aes(x=fitted.curve(15),y=15),size=6,shape=17,
             color="green",alpha=0.9)+
  annotate(geom = "text",x=fitted.curve(15),y=11,
           label=round(fitted.curve(15),2),
           vjust=6,color="red")+
  coord_cartesian(clip = "off")
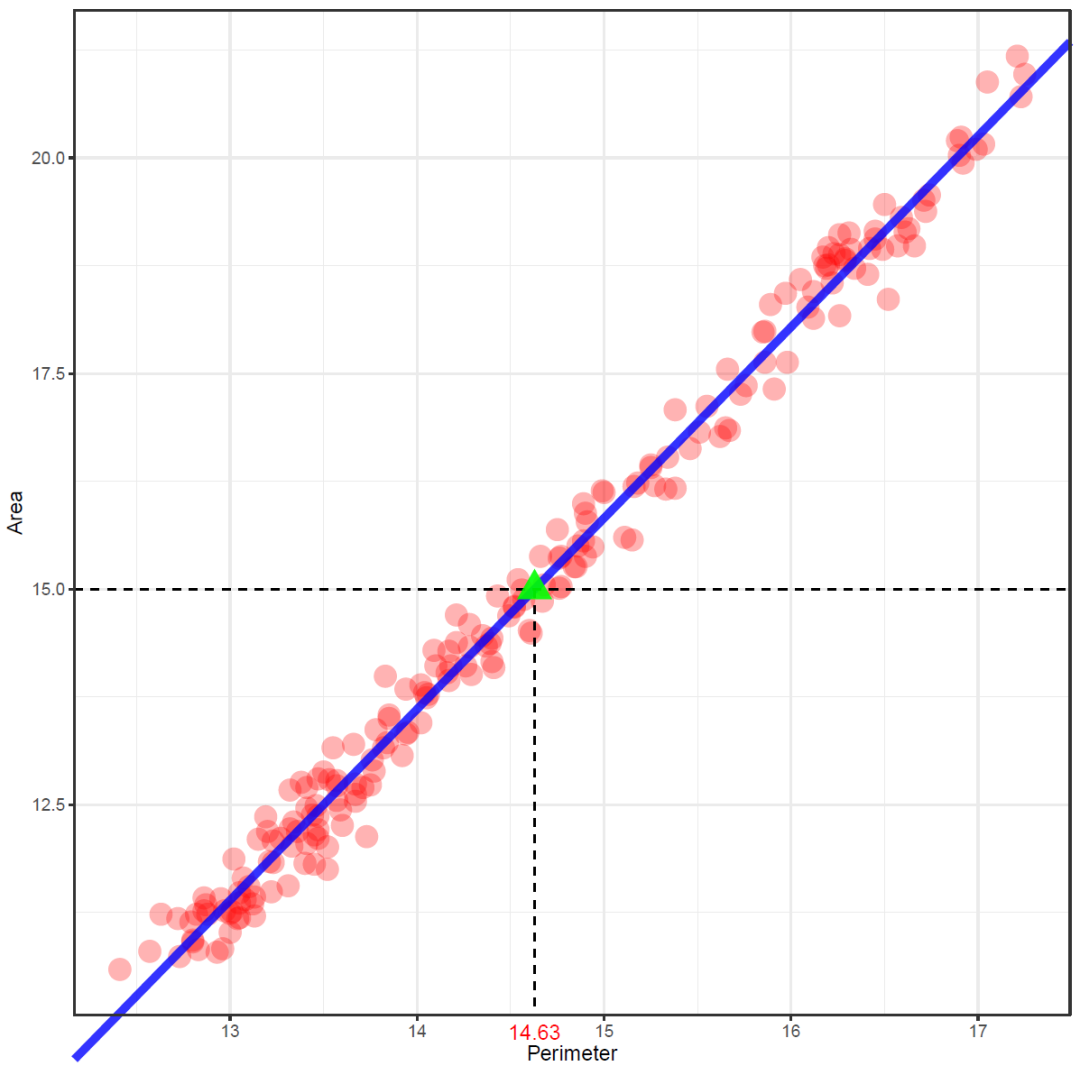
这里左下角有点超界了,出图后手动调整吧,暂时不知道如何用代码控制拟合线的范围。
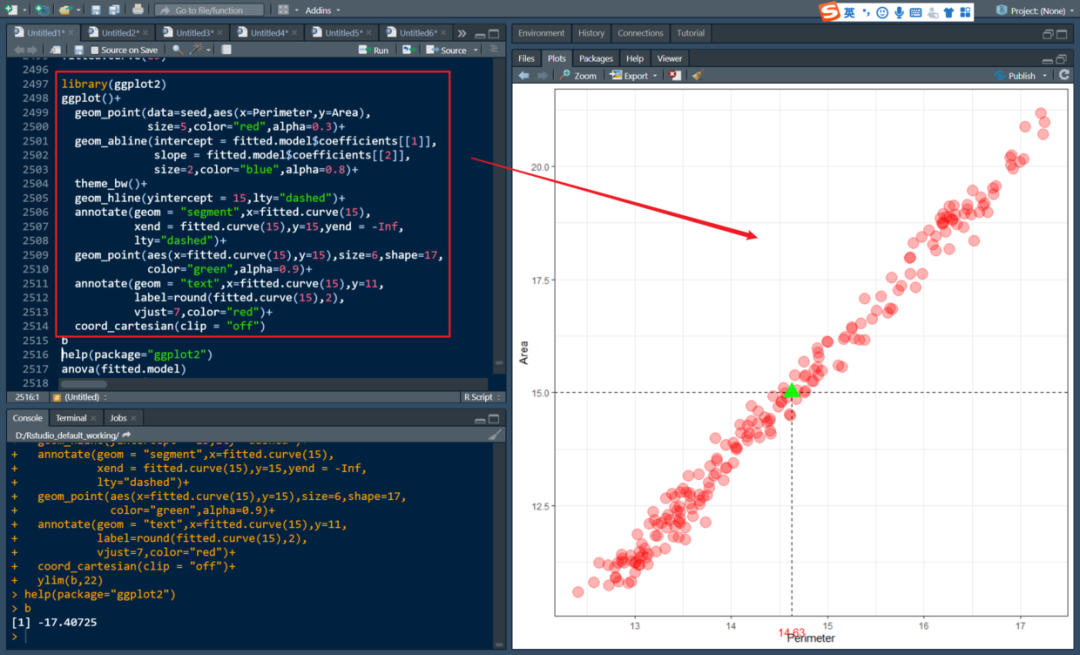
这里还遇到一个问题是: 在Rstudio的出图界面是没有这条蓝色的线的,但是保存pdf格式文件里却有,这里不知道是什么情况
需要示例数据可以直接留言
欢迎大家关注我的公众号
小明的数据分析笔记本
本文分享自微信公众号 - 小明的数据分析笔记本(gh_0c8895f349d3)。
如有侵权,请联系 support@oschina.cn 删除。
本文参与“OSC源创计划”,欢迎正在阅读的你也加入,一起分享。
来源:oschina
链接:https://my.oschina.net/u/4579431/blog/4957180