本节提要:matplotlib中的柱状图系列,bar、barh绘图函数的常见参数与应用实例。
一、简谈柱状图
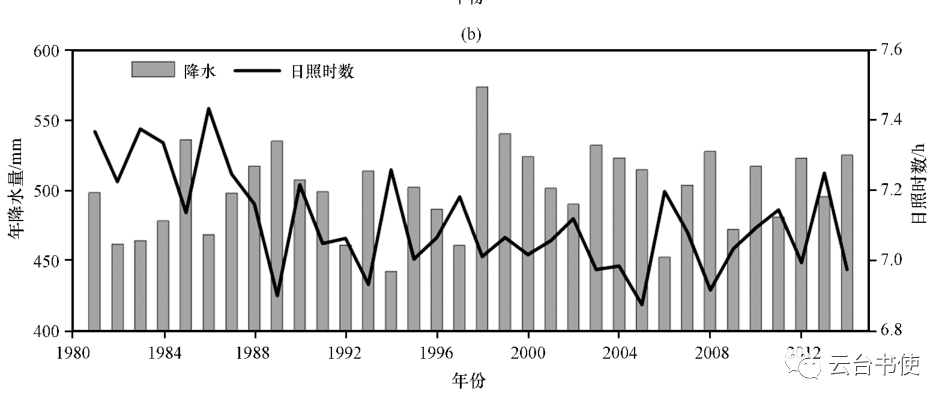
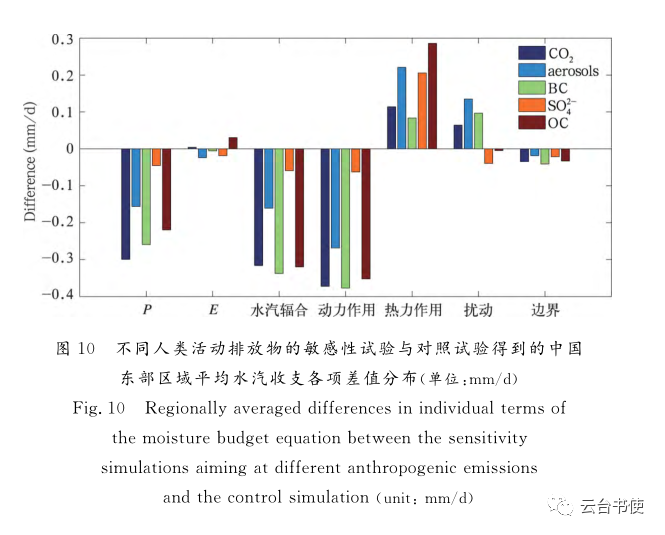
| bar柱状图的常用参数 |
|
| x |
一般为横轴的坐标序列 |
| y (height) |
一般为纵轴的数值序列 |
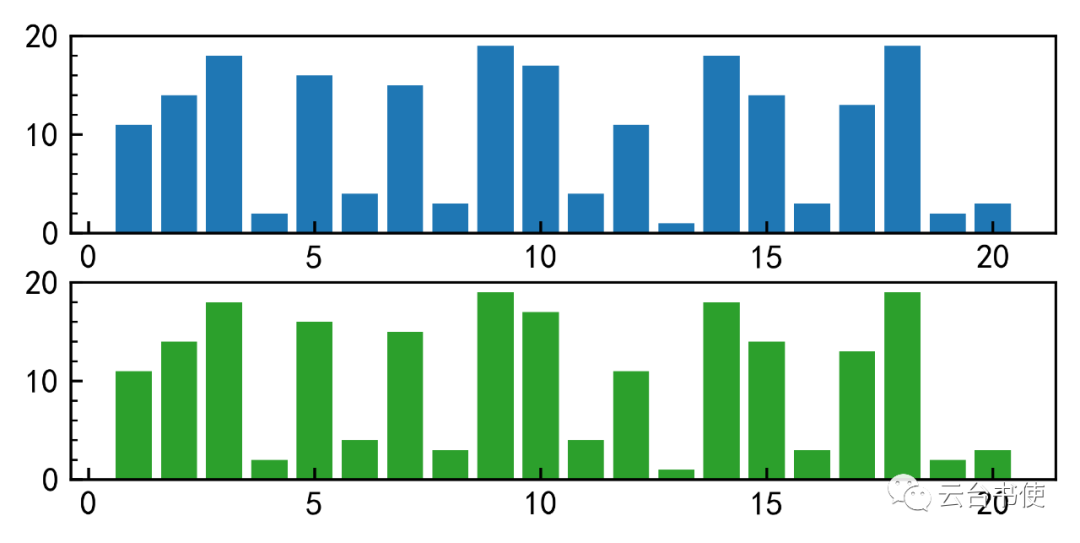
| color or facecolor |
修改柱体颜色 |
import matplotlib.pyplot as pltimport numpy as npimport matplotlib.ticker as mtickerplt.rcParams['font.sans-serif']=['SimHei']#中文plt.rcParams['axes.unicode_minus']=False#负号def sample_data():#拟造数据x=np.array([1,2,3,4,5,6,7,8,9,10,11,12,13,14,15,16,17,18,19,20])y=np.array([11,14,18,2,16,4,15,3,19,17,4,11,1,18,14,3,13,19,2,3])return x,yx,y=sample_data()#获得数据fig=plt.figure(figsize=(4,2),dpi=500)#添加画布ax1=fig.add_axes([0,0,1,0.4])#添加子图ax2=fig.add_axes([0,0.5,1,0.4])ax1.bar(x,y,color='tab:green')ax2.bar(x,y,color='tab:blue')#############下面是针对图表刻度等细节的修改##############ax1.set_ylim(0,20)ax1.tick_params(axis='both',which='both',direction='in')ax1.xaxis.set_major_locator(mticker.MultipleLocator(5))ax1.yaxis.set_minor_locator(mticker.MultipleLocator(2))ax2.set_ylim(0,20)ax2.tick_params(axis='both',which='both',direction='in')ax2.xaxis.set_major_locator(mticker.MultipleLocator(5))ax2.yaxis.set_minor_locator(mticker.MultipleLocator(2))plt.show()
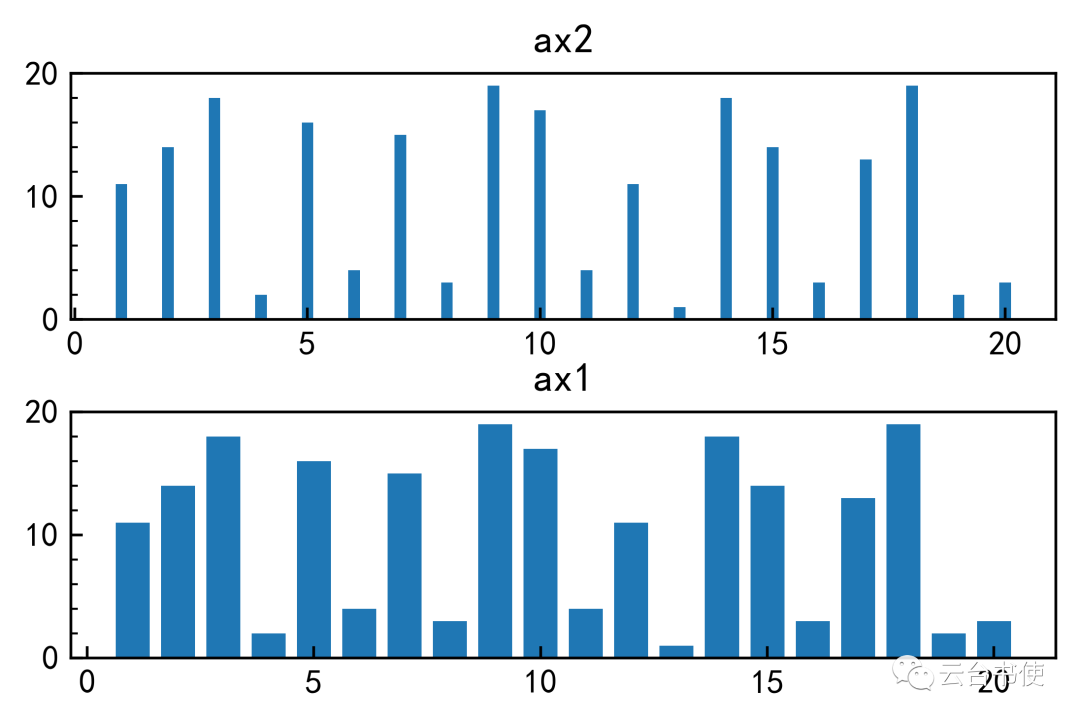
| width |
调整柱体宽度 |
ax1.bar(x,y,width=0.75)ax2.bar(x,y,width=0.25)
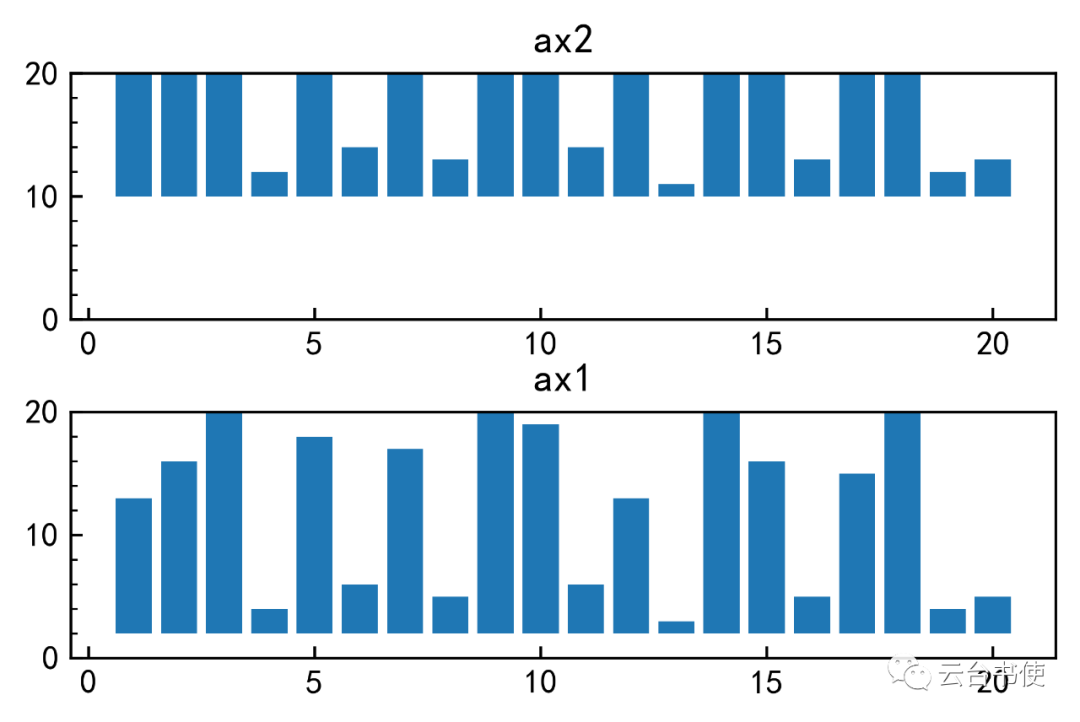
| bottom |
调整柱状图底部的原始高度 |
ax1.bar(x,y,bottom=2)ax2.bar(x,y,bottom=10)
| edgecolor |
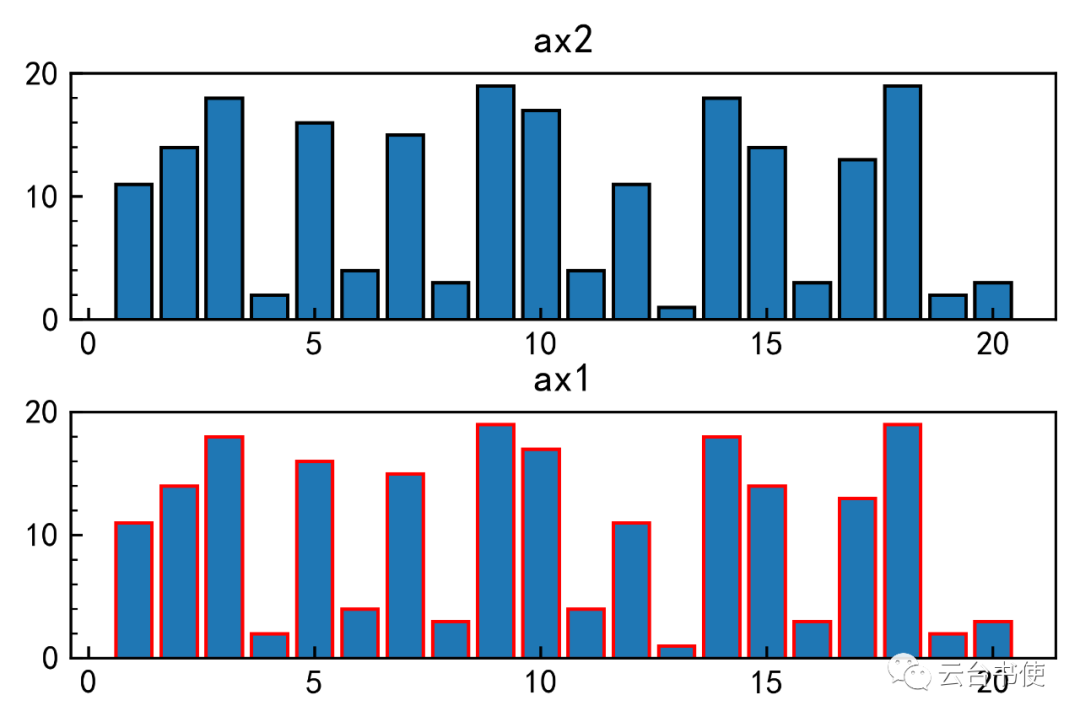
边框颜色 |
ax1.bar(x,y,edgecolor='r')ax2.bar(x,y,edgecolor='k')
| linewidth |
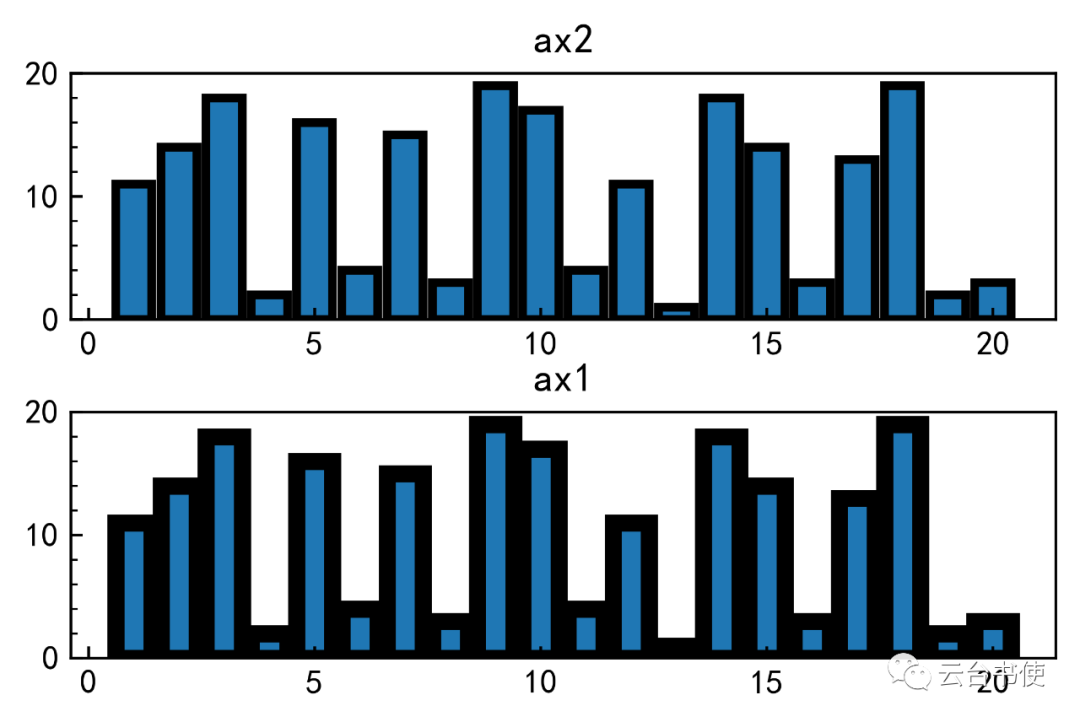
调整边框宽度 |
ax1.bar(x,y,linewidth=5,edgecolor='k')ax2.bar(x,y,linewidth=2.55,edgecolor='k')
| xerr,yerr |
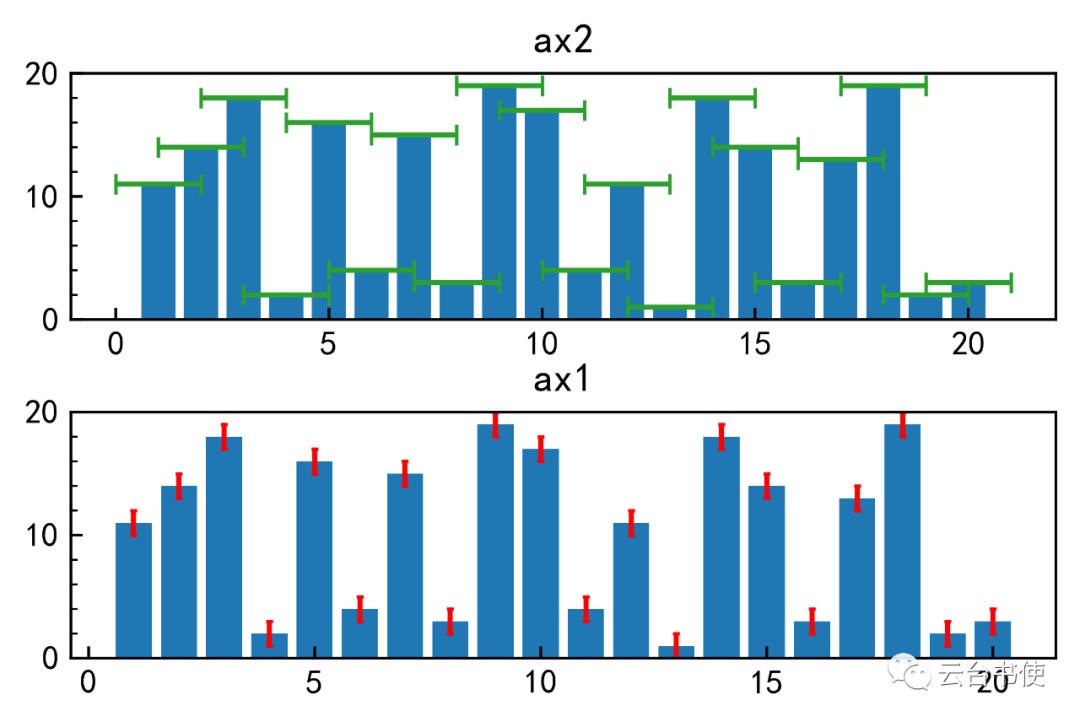
误差线 |
| ecolor |
误差线颜色 |
| capsize |
误差线帽长度 |
ax1.bar(x,y,yerr=True,ecolor='r',capsize=1)ax2.bar(x,y,xerr=True,ecolor='tab:green',capsize=3)
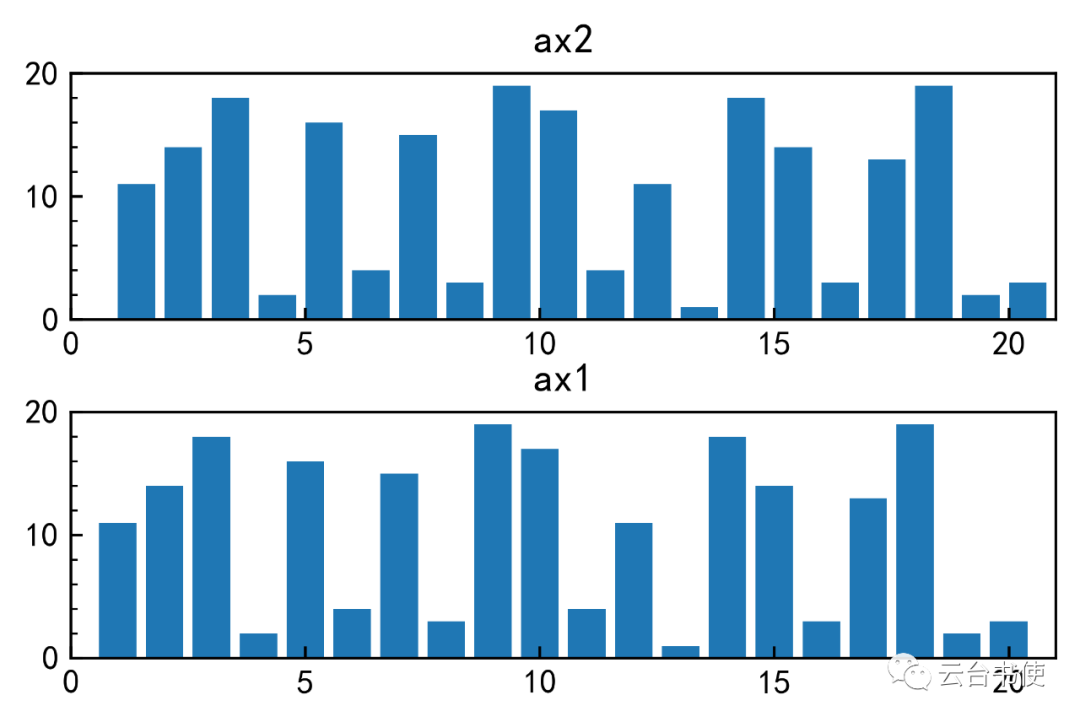
| align |
edge或center,柱体位置 |
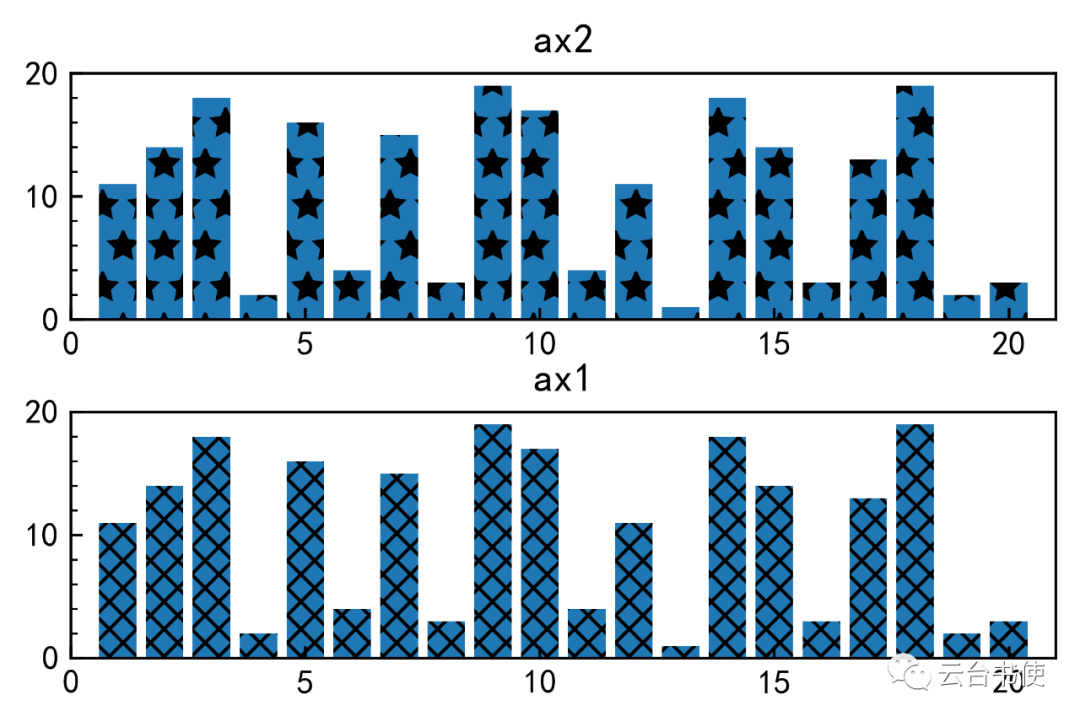
| hatch |
柱体内部网格线填充样式 |
ax1.bar(x,y,hatch='xxx')ax2.bar(x,y,hatch='*')
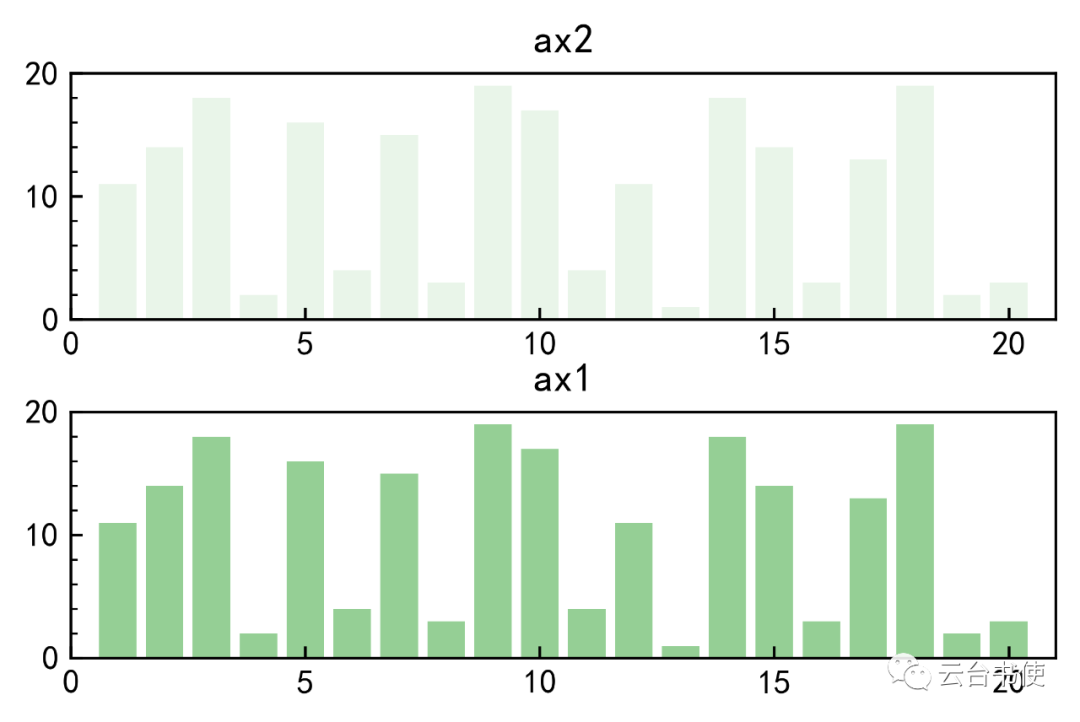
| alpha |
透明度 |
ax1.bar(x,y,color='tab:green',alpha=0.5)ax2.bar(x,y,color='tab:green',alpha=0.1)
| log |
是否开启对数坐标轴 |
本节主要简单介绍柱状图的一些实用绘制方法:
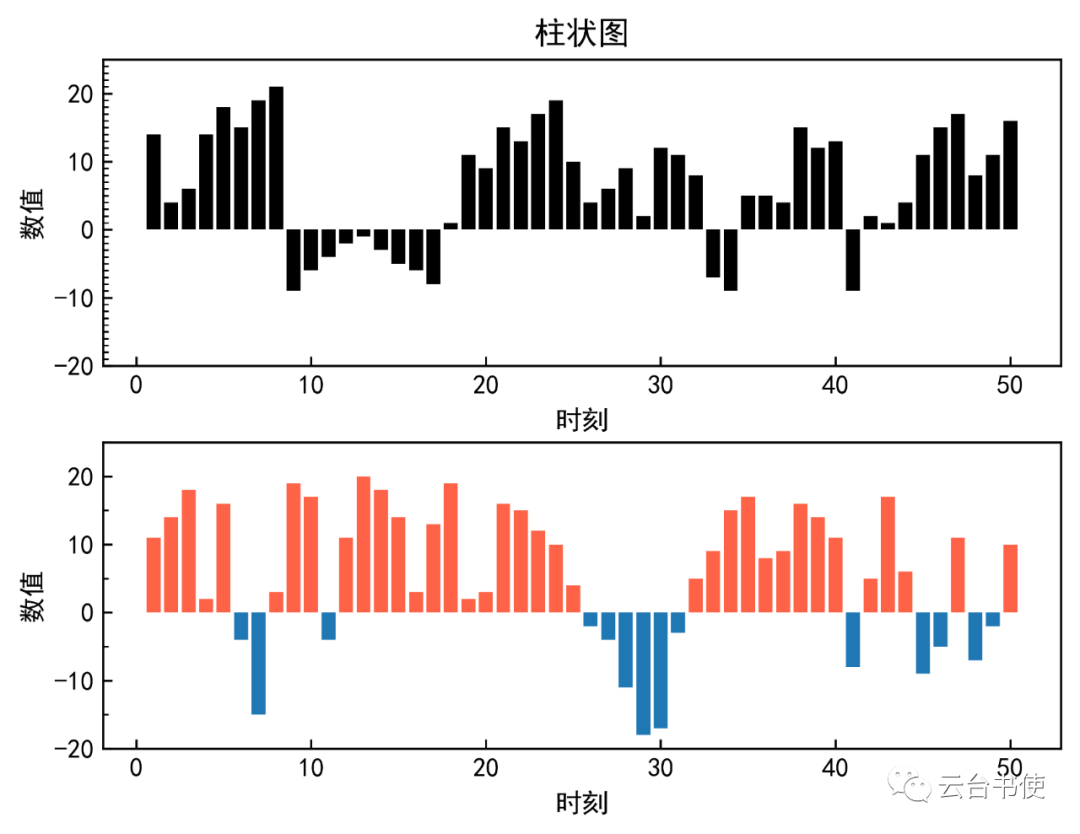
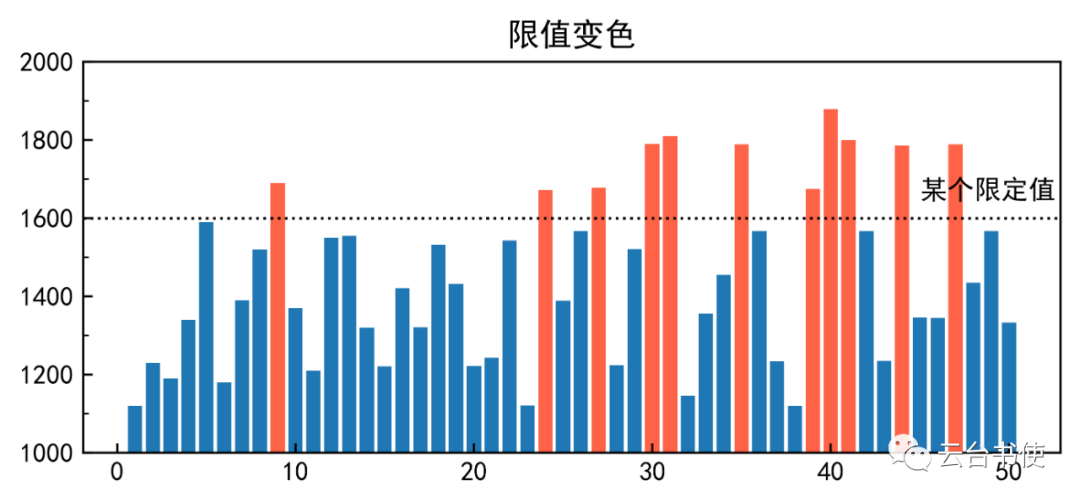
A、如何使柱体在区分正负值(特别是距平),或者突破某一限制值柱体的颜色能够不一致
只需要一个np.where( )命令即可完成,这个命令在前面已经介绍过了,这里也可以用,看不懂就跑代码编代码。
import matplotlib.pyplot as pltimport numpy as npimport matplotlib.ticker as mtickerplt.rcParams['font.sans-serif']=['SimHei']#中文plt.rcParams['axes.unicode_minus']=False#负号def sample_data():#拟造数据x=np.array([1,2,3,4,5,6,7,8,9,10,11,12,13,14,15,16,17,18,19,20,21,22,23,24,25,26,27,28,29,30,31,32,33,34,35,36,37,38,39,40,41,42,43,44,45,46,47,48,49,50])x2=np.array([1,2,3,4,5])y1=np.array([11,14,18,2,16,-4,-15,3,19,17,-4,11,20,18,14,3,13,19,2,3,16,15,12,10,4,-2,-4,-11,-18,-17,-3,5,9,15,17,8,9,16,14,11,-8,5,17,6,-9,-5,11,-7,-2,10])y2=np.array([14,4,6,14,18,15,19,21,-9,-6,-4,-2,-1,-3,-5,-6,-8,1,11,9,15,13,17,19,10,4,6,9,2,12,11,8,-7,-9,5,5,4,15,12,13,-9,2,1,4,11,15,17,8,11,16])y3=np.array([1120,1230,1190,1340,1590,1180,1390,1520,1690,1370,1210,1550,1555,1320,1221,1421,1321,1532,1432,1222,1243,1543,1121,1672,1389,1567,1678,1224,1521,1790,1810,1146,1356,1455,1789,1567,1234,1120,1675,1879,1800,1567,1235,1786,1346,1345,1789,1435,1567,1333])y4=np.array([24,27,29,35,33,21])y5=np.array([14,24,27,19,30])return x,x2,y1,y2,y3,y4,y5x,x2,y1,y2,y3,y4,y5=sample_data()#获得数据fig=plt.figure(figsize=(5,4),dpi=600)#添加画布等ax1=fig.add_axes([0,0,1,0.4])ax2=fig.add_axes([0,0.5,1,0.4])ax1.bar(x,y1,color=np.where(y1>0,'tomato','tab:blue'))ax2.bar(x,y2,color='k')ax1.set_ylim(-20,25)ax1.tick_params(axis='both',which='both',direction='in')ax1.yaxis.set_minor_locator(mticker.MultipleLocator(5))ax1.set_xlabel('时刻')ax1.set_ylabel('数值')ax2.set_ylim(-20,25)ax2.tick_params(axis='both',which='both',direction='in')ax2.yaxis.set_minor_locator(mticker.MultipleLocator(1))ax2.set_xlabel('时刻')ax2.set_ylabel('数值')plt.title('柱状图')plt.savefig('a',bbox_inches='tight')plt.show()
fig=plt.figure(figsize=(5,2),dpi=500)ax=fig.add_axes([0,0,1,1])ax.bar(x,y3,color=np.where(y3>1600,'tomato','tab:blue'))ax.axhline(y=1600,c='k',ls=':',lw=1)ax.set_ylim(1000,2000)ax.tick_params(axis='both',which='both',direction='in')ax.yaxis.set_minor_locator(mticker.MultipleLocator(100))ax.text(45,1650,'某个限定值')ax.set_title('限值变色')plt.savefig('a',bbox_inches='tight')plt.show()
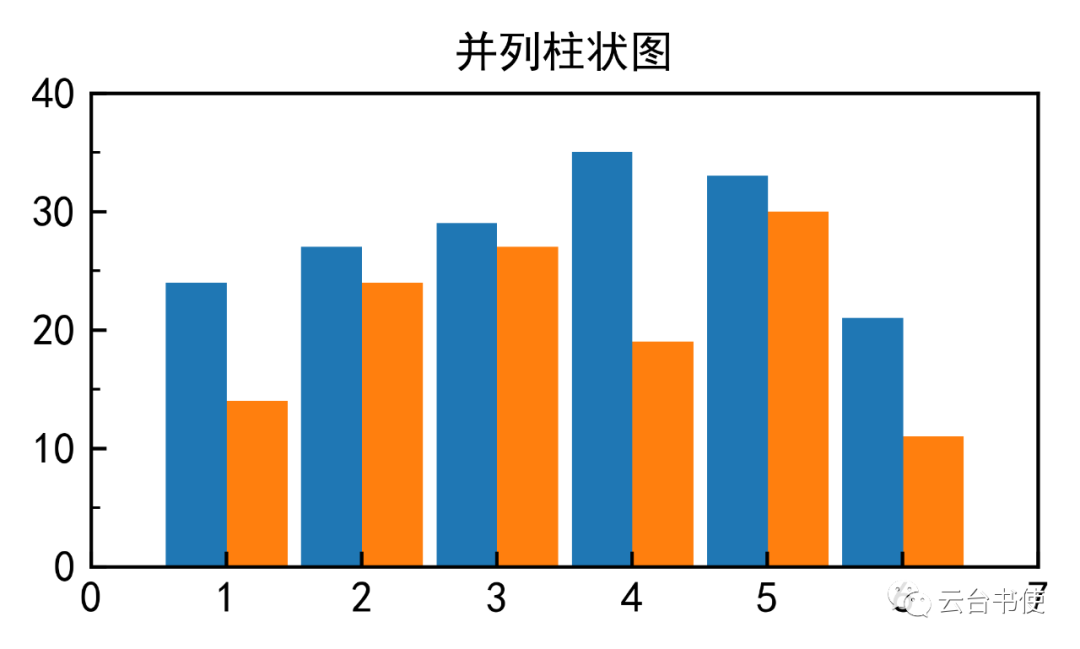
B、如何并列多个数据(即类似第一节图二)
其实就是把每个柱体的横坐标挪动一下,我的数据比较小,所以是手动挪动,如果超过三种,最好用公式来挪动。
fig=plt.figure(figsize=(3,1.5),dpi=600)#添加画布等ax=fig.add_axes([0,0,1,1])bar1=ax.bar(x2-0.22,y4,width=0.45)bar2=ax.bar(x2+0.23,y5,width=0.45)ax.set_title('并列柱状图',fontsize=10)ax.set(xlim=(0,7),ylim=(0,40))ax.tick_params(axis='both',which='both',direction='in')ax.yaxis.set_minor_locator(mticker.MultipleLocator(5))
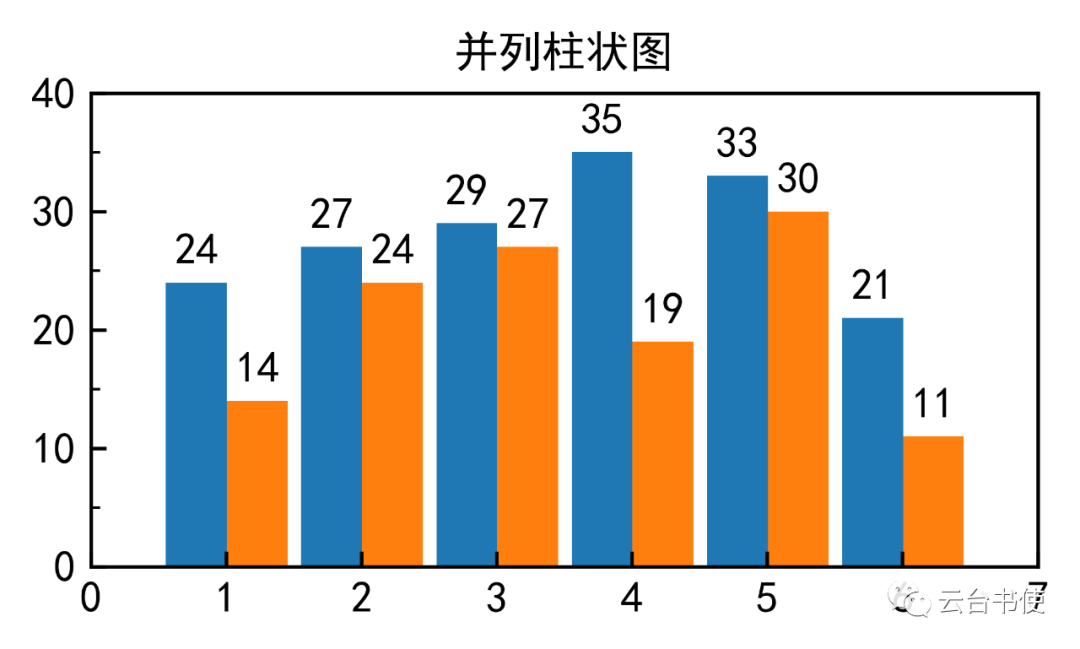
C、如何在柱体头部标值
可以手动读取,也可以参考官网的方法,获得当前柱体高度,然后标值
fig=plt.figure(figsize=(3,1.5),dpi=600)#添加画布等ax=fig.add_axes([0,0,1,1])bar1=ax.bar(x2-0.22,y4,width=0.45)bar2=ax.bar(x2+0.23,y5,width=0.45)ax.set_title('并列柱状图',fontsize=10)ax.set(xlim=(0,7),ylim=(0,40))ax.tick_params(axis='both',which='both',direction='in')ax.yaxis.set_minor_locator(mticker.MultipleLocator(5))def autolabel(rects):for rect in rects:height = rect.get_height()ax.annotate('{}'.format(height),xy=(rect.get_x() + rect.get_width() / 2, height),xytext=(0, 3), # 3 points vertical offsettextcoords="offset points",ha='center', va='bottom')autolabel(bar1)autolabel(bar2)
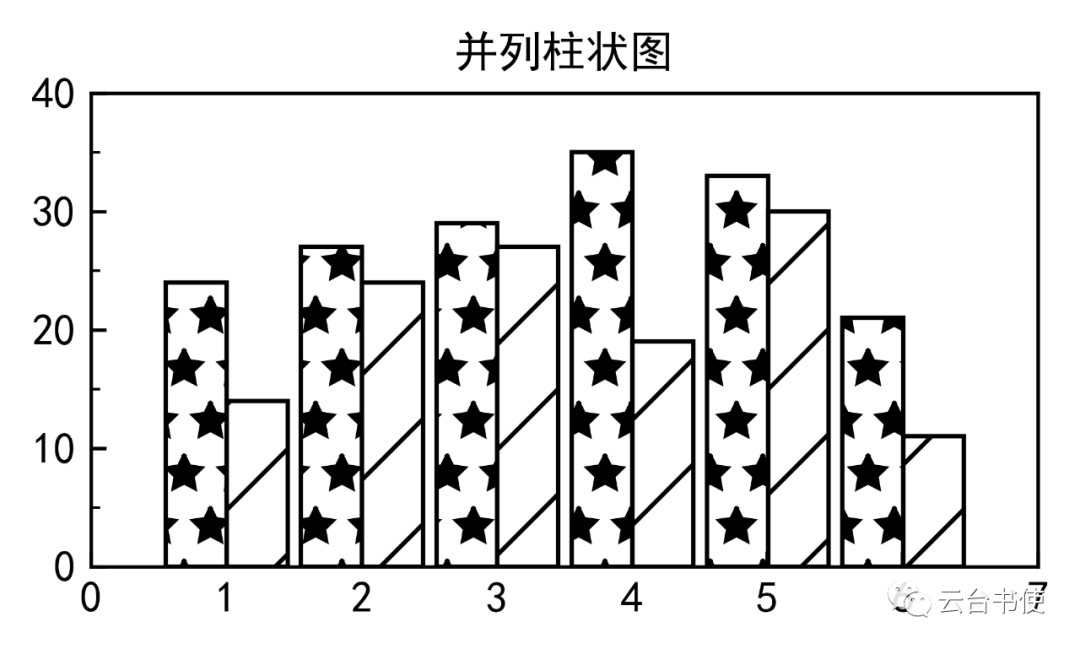
D、黑白刊物投稿
现在很多其实已经是彩色刊物了,但是仍然留在此处参考。
一般绘制图片时,选取在色盘上成对角关系的颜色,打印成黑白的照片后仍然可以清晰的分辨每种柱体;或者使用前面提到的关键字参数hatch来改变内部填充样式分辨柱体。
bar1=ax.bar(x2-0.22,y4,edgecolor='k',facecolor='none',hatch='*',width=0.45)bar2=ax.bar(x2+0.23,y5,edgecolor='k',facecolor='none',hatch='/',width=0.45)
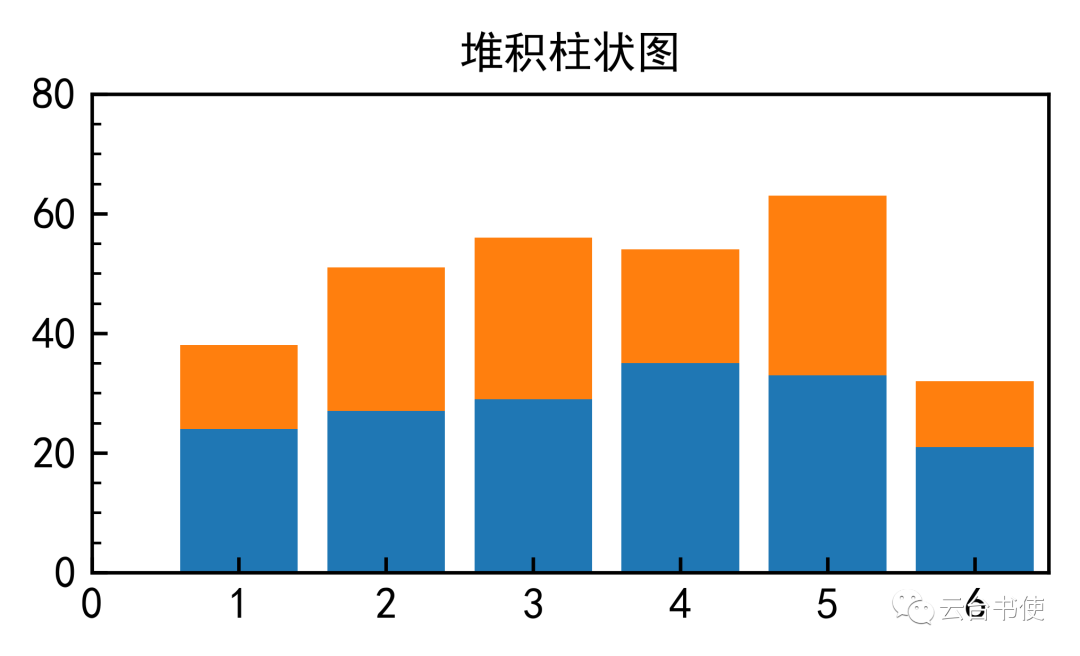
E、堆积柱状图
这个图的绘制要用到bottom参数,将第二个bar的下界设定为第一个bar高度值
fig=plt.figure(figsize=(3,1.5),dpi=600)ax=fig.add_axes([0,0,1,1])bar1=ax.bar(x2,y4)bar2=ax.bar(x2,y5,bottom=y4)ax.set_title('堆积柱状图',fontsize=10)ax.set(xlim=(0,6.5),ylim=(0,80))ax.tick_params(axis='both',which='both',direction='in')ax.yaxis.set_minor_locator(mticker.MultipleLocator(5))
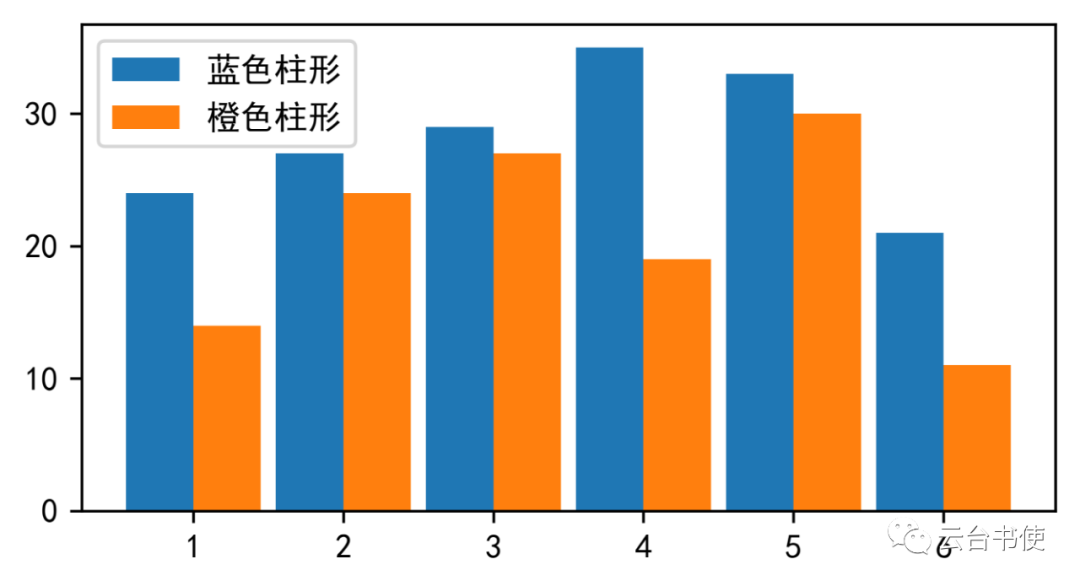
F、给柱状图添加图例
使用legend( )命令来给柱状图添加图例
fig=plt.figure(figsize=(4,2),dpi=600)#添加画布等ax=fig.add_axes([0,0,1,1])width=0.45bar1=ax.bar(x2-width/2,y4,width)bar2=ax.bar(x2+width/2,y5,width)ax.legend([bar1,bar2],['蓝色柱形','橙色柱形'])
参考资料:
1961至2010 年利川市极端气温变化分析 , 张成平, 资源与环境科学
人类活动排放的CO及气溶胶对20世纪70年代末中国东部夏季降水年代际转折的影响 ,王欢 李栋梁 ,气象学报
集合柱状图与标记数值:https://matplotlib.org/gallery/lines_bars_and_markers/barchart.html#sphx-glr-gallery-lines-bars-and-markers-barchart-py

本文分享自微信公众号 - 气象学家(Meteorologist2019)。
如有侵权,请联系 support@oschina.cn 删除。
本文参与“OSC源创计划”,欢迎正在阅读的你也加入,一起分享。
来源:oschina
链接:https://my.oschina.net/u/4579644/blog/4409537