目录
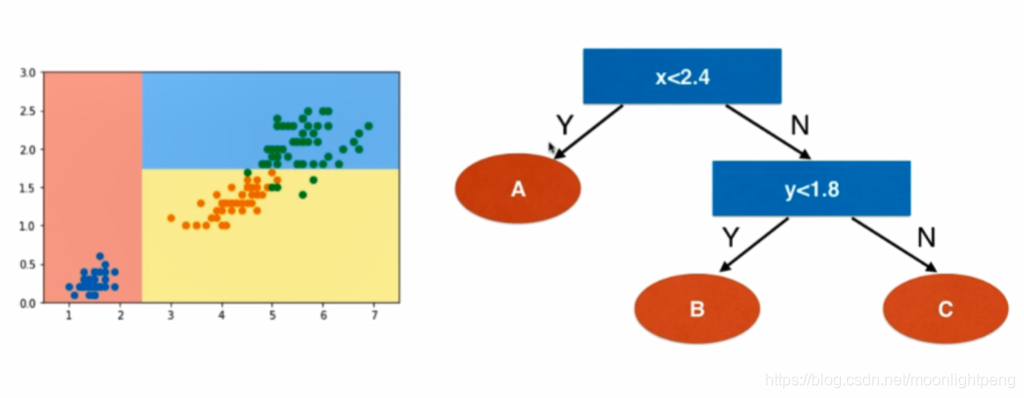
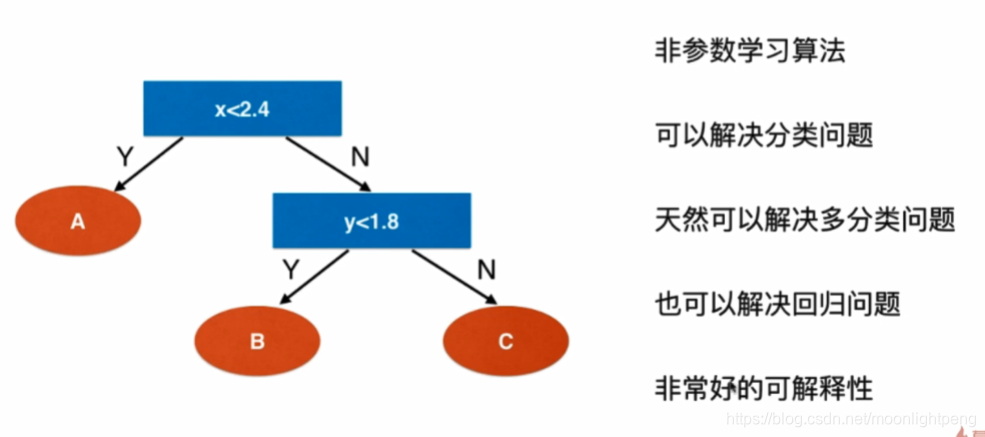
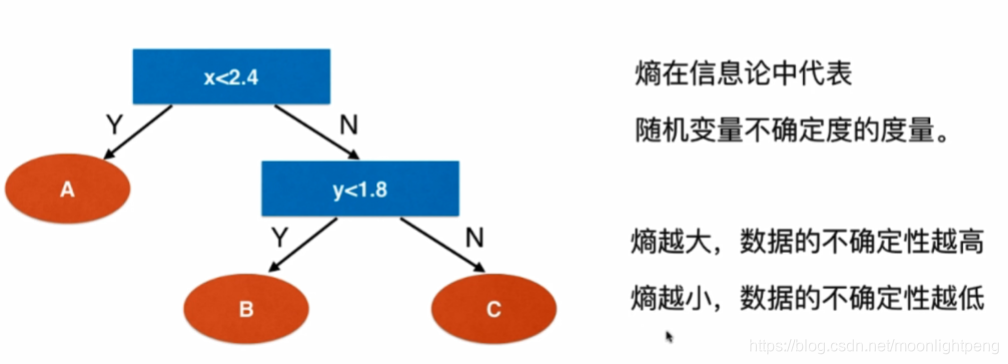
什么是决策树

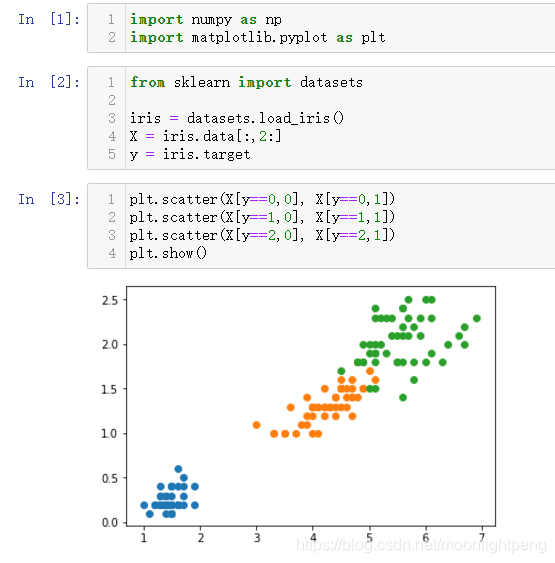
取后两个维度
from sklearn import datasets

iris = datasets.load_iris()
X = iris.data[:,2:]
y = iris.target


plt.scatter(X[y==0,0], X[y==0,1])
plt.scatter(X[y==1,0], X[y==1,1])
plt.scatter(X[y==2,0], X[y==2,1])
plt.show()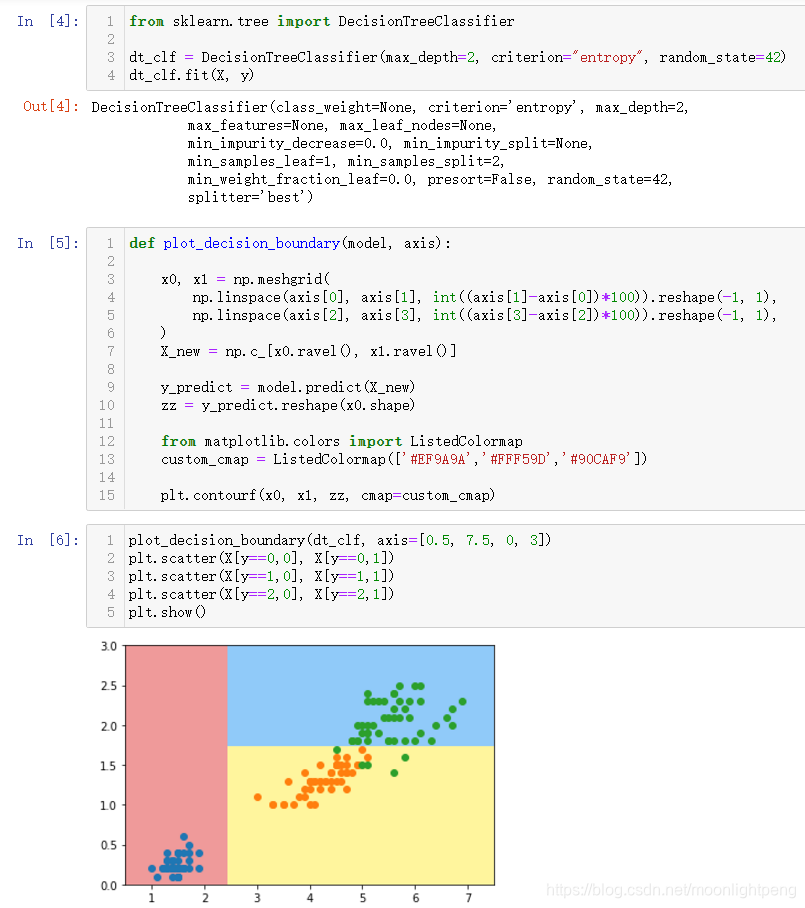
from sklearn.tree import DecisionTreeClassifier

dt_clf = DecisionTreeClassifier(max_depth=2, criterion="entropy", random_state=42)
dt_clf.fit(X, y)


def plot_decision_boundary(model, axis):

    x0, x1 = np.meshgrid(
        np.linspace(axis[0], axis[1], int((axis[1]-axis[0])*100)).reshape(-1, 1),
        np.linspace(axis[2], axis[3], int((axis[3]-axis[2])*100)).reshape(-1, 1),
    )
    X_new = np.c_[x0.ravel(), x1.ravel()]

    y_predict = model.predict(X_new)
    zz = y_predict.reshape(x0.shape)

    from matplotlib.colors import ListedColormap
    custom_cmap = ListedColormap(['#EF9A9A','#FFF59D','#90CAF9'])

    plt.contourf(x0, x1, zz, cmap=custom_cmap)


plot_decision_boundary(dt_clf, axis=[0.5, 7.5, 0, 3])
plt.scatter(X[y==0,0], X[y==0,1])
plt.scatter(X[y==1,0], X[y==1,1])
plt.scatter(X[y==2,0], X[y==2,1])
plt.show()

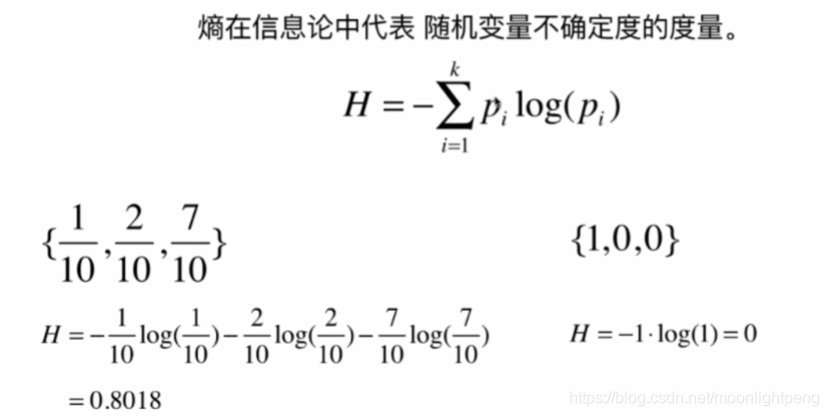
12-2 信息熵
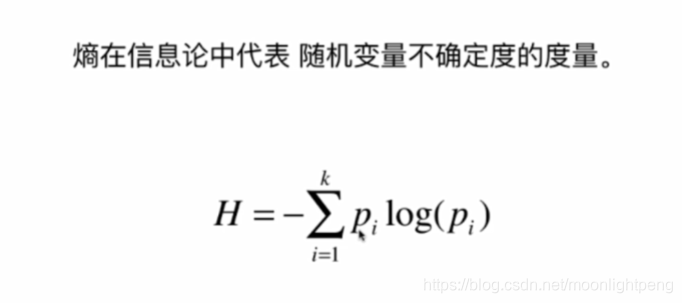
pi<1,所以log(pi)<0
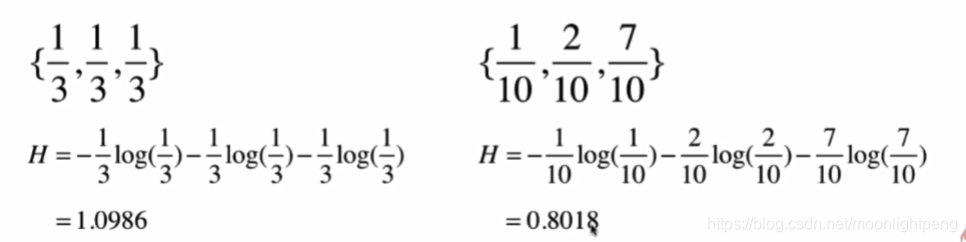
不确定度的度量
越大系统越不确定越随机
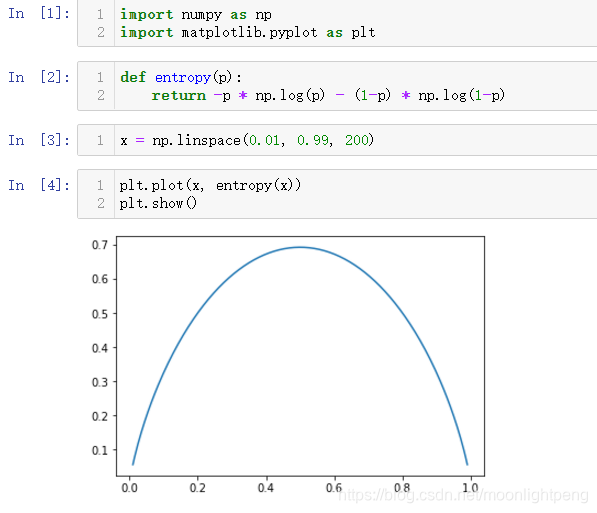
二分类
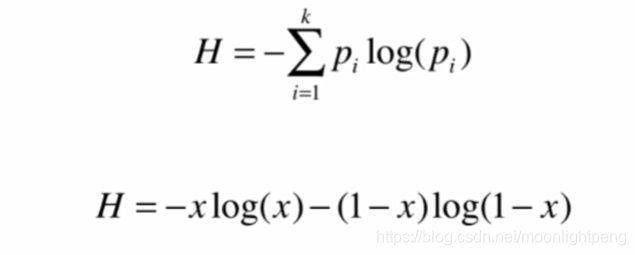
三类就是立体的曲面
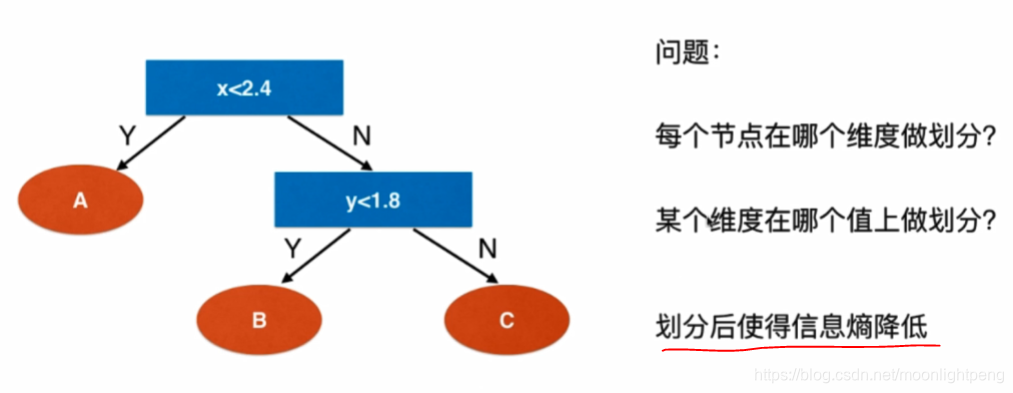
12-3 使用信息熵寻找最优划分
传统的算法与数据结构是最基础的很重要
基于最前面的程序
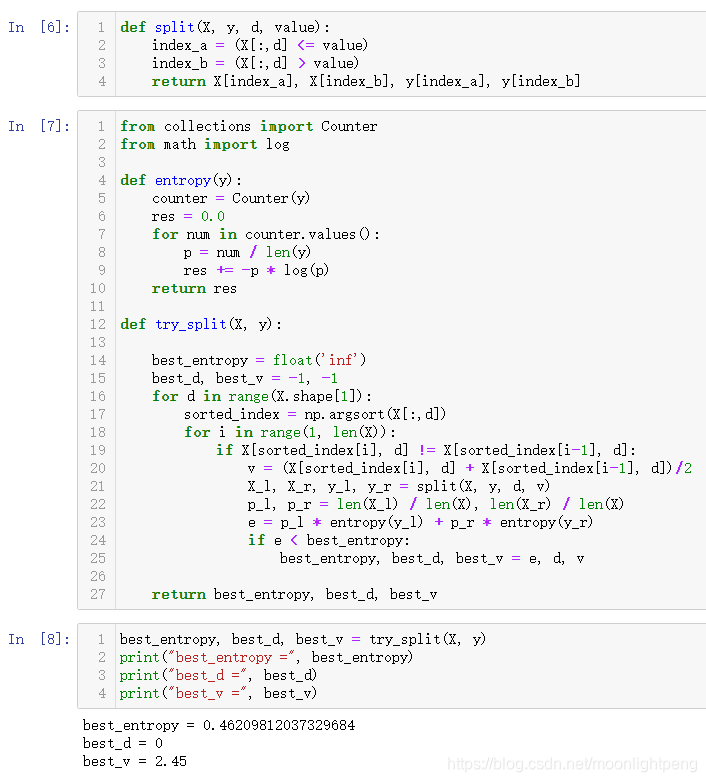
def split(X, y, d, value):
    index_a = (X[:,d] <= value)
    index_b = (X[:,d] > value)
    return X[index_a], X[index_b], y[index_a], y[index_b]
from collections import Counter
from math import log
def entropy(y):
counter = Counter(y)
res = 0.0
for num in counter.values():
p = num / len(y)
res += -p * log(p)
return res
def try_split(X, y):
best_entropy = float('inf')
best_d, best_v = -1, -1
for d in range(X.shape[1]):
sorted_index = np.argsort(X[:,d])
for i in range(1, len(X)):
if X[sorted_index[i], d] != X[sorted_index[i-1], d]:
v = (X[sorted_index[i], d] + X[sorted_index[i-1], d])/2
X_l, X_r, y_l, y_r = split(X, y, d, v)
p_l, p_r = len(X_l) / len(X), len(X_r) / len(X)
e = p_l * entropy(y_l) + p_r * entropy(y_r)
if e < best_entropy:
best_entropy, best_d, best_v = e, d, v
return best_entropy, best_d, best_v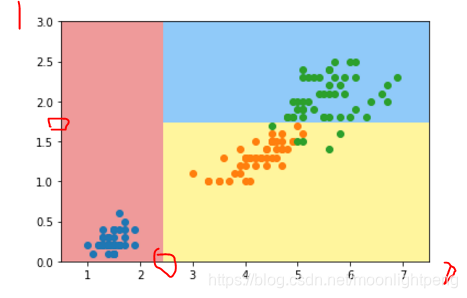
d维度,best_d 是在哪一个维度 best_v哪一个阈值
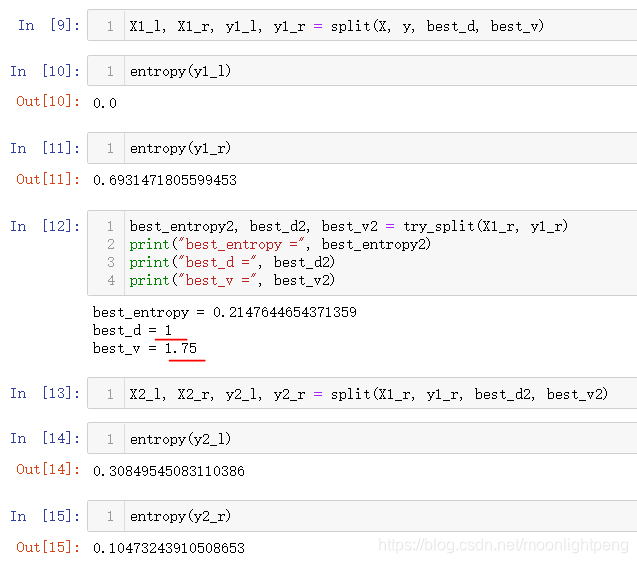
best_d = 0 表示x轴
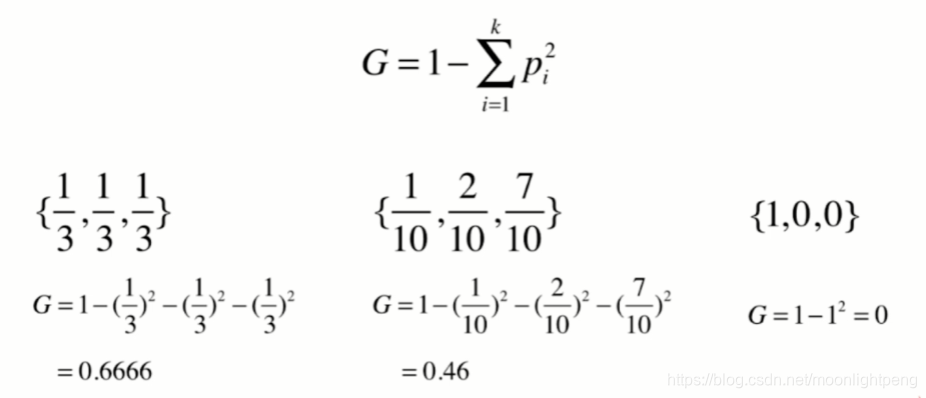
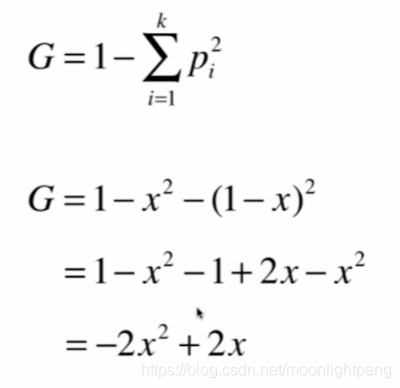
12-4 基尼系数
以二分类画出曲线
相邻两样本在d维度上不相等
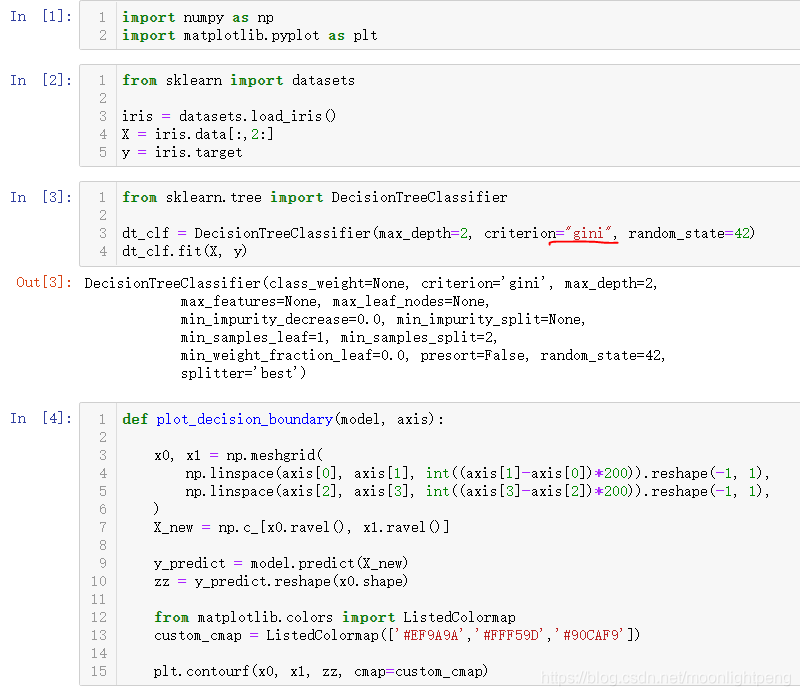
from sklearn import datasets

iris = datasets.load_iris()
X = iris.data[:,2:]
y = iris.target


from sklearn.tree import DecisionTreeClassifier

dt_clf = DecisionTreeClassifier(max_depth=2, criterion="gini", random_state=42)
dt_clf.fit(X, y)


def plot_decision_boundary(model, axis):

    x0, x1 = np.meshgrid(
        np.linspace(axis[0], axis[1], int((axis[1]-axis[0])*200)).reshape(-1, 1),
        np.linspace(axis[2], axis[3], int((axis[3]-axis[2])*200)).reshape(-1, 1),
    )
    X_new = np.c_[x0.ravel(), x1.ravel()]

    y_predict = model.predict(X_new)
    zz = y_predict.reshape(x0.shape)

    from matplotlib.colors import ListedColormap
    custom_cmap = ListedColormap(['#EF9A9A','#FFF59D','#90CAF9'])

    plt.contourf(x0, x1, zz, cmap=custom_cmap)


plot_decision_boundary(dt_clf, axis=[0.5, 7.5, 0, 3])
plt.scatter(X[y==0,0], X[y==0,1])
plt.scatter(X[y==1,0], X[y==1,1])
plt.scatter(X[y==2,0], X[y==2,1])
plt.show()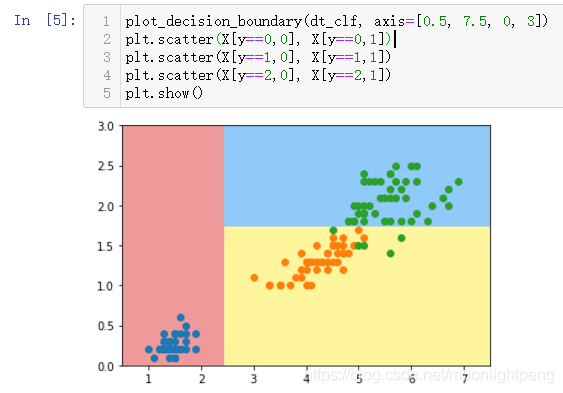
模拟使用基尼系数划分
from collections import Counter
from math import log

def split(X, y, d, value):
    index_a = (X[:,d] <= value)
    index_b = (X[:,d] > value)
    return X[index_a], X[index_b], y[index_a], y[index_b]

def gini(y):
    counter = Counter(y)
    res = 1.0
    for num in counter.values():
        p = num / len(y)
        res -= p**2
    return res

def try_split(X, y):

    best_g = float('inf')
    best_d, best_v = -1, -1
    for d in range(X.shape[1]):
        sorted_index = np.argsort(X[:,d])
        for i in range(1, len(X)):
            if X[sorted_index[i], d] != X[sorted_index[i-1], d]:
                v = (X[sorted_index[i], d] + X[sorted_index[i-1], d])/2
                X_l, X_r, y_l, y_r = split(X, y, d, v)
                p_l, p_r = len(X_l) / len(X), len(X_r) / len(X)
                g = p_l * gini(y_l) + p_r * gini(y_r)
                if g < best_g:
                    best_g, best_d, best_v = g, d, v

    return best_g, best_d, best_v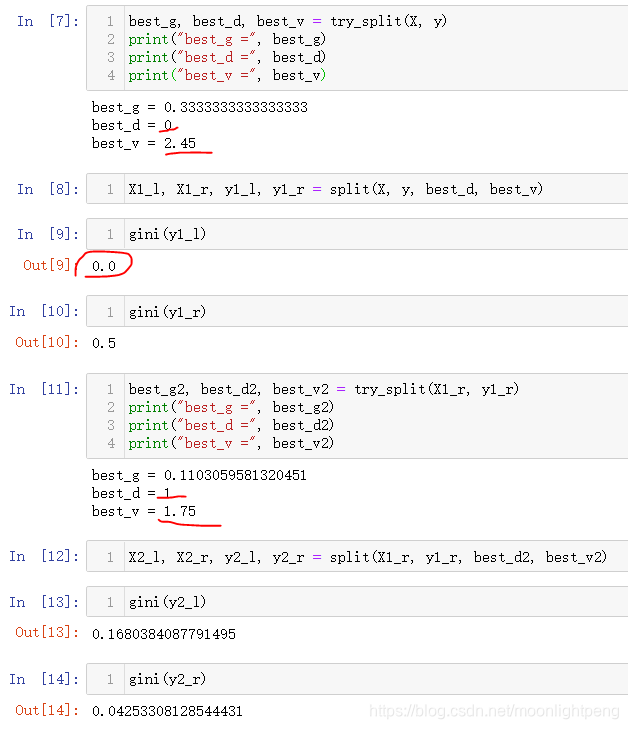
对比信息熵和基尼系统

来源:oschina
链接:https://my.oschina.net/u/4399244/blog/4309592