使用到的方法
- plt.figure() //可以理解为声明窗口
- plt.plot() // 线的坐标值
- plt.show() // 显示
import matplotlib.pyplot as plt
import numpy as np
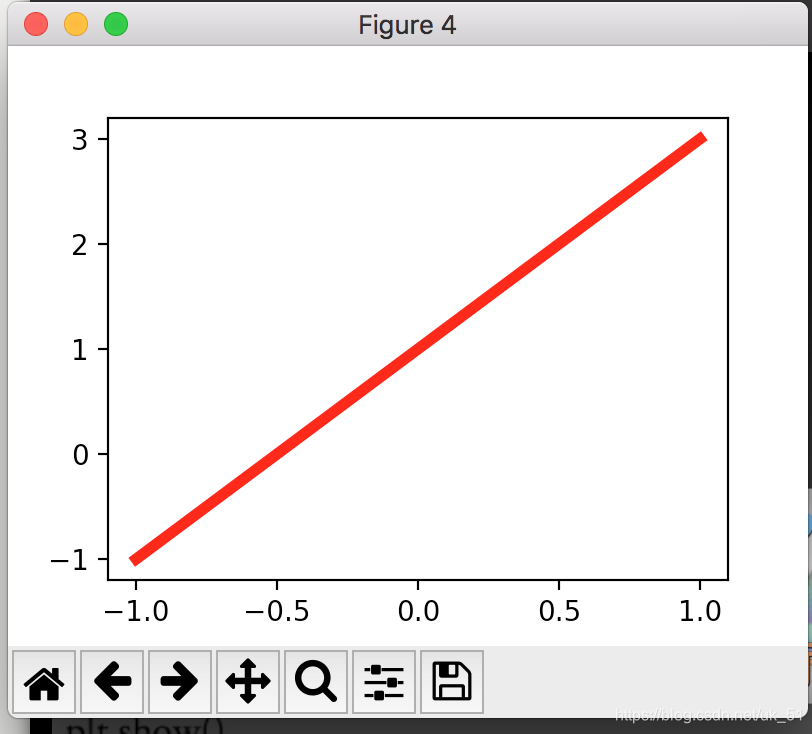
x = np.linspace(-1,1,50) //取值范围以及点数
y = 2*x+1 //方程
plt.figure(num=4, figsize=(4,3)) // 窗口名称 和 大小
plt.plot(x,y, color='red', linewidth=4) // 画线
plt.show()
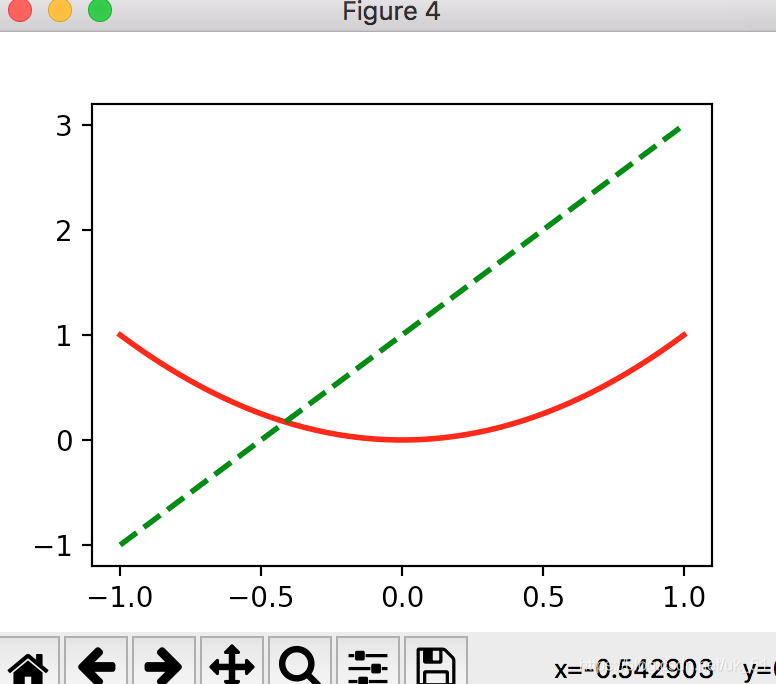
多条线
import matplotlib.pyplot as plt
import numpy as np

x = np.linspace(-1,1,50)
y1 = x**2
y2 = 2*x+1
plt.figure(num=4, figsize=(4,3))
plt.plot(x,y1, color='red', linewidth=2)
plt.plot(x,y2, color='green', linewidth=2, linestyle='--')
plt.show()
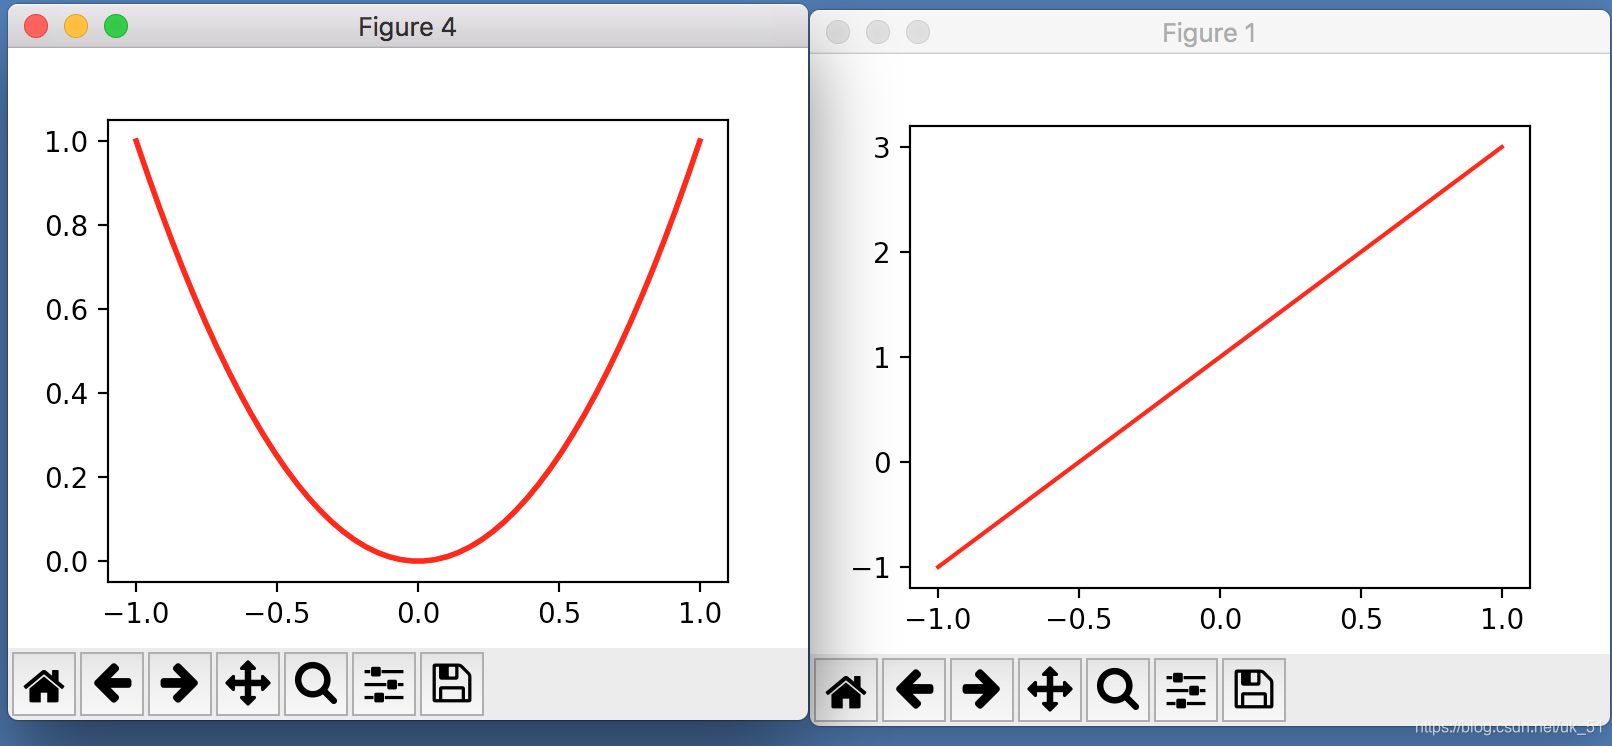
多窗口
import matplotlib.pyplot as plt
import numpy as np

x = np.linspace(-1,1,50)
y1 = x**2
y2 = 2*x+1

plt.figure(num=4, figsize=(4,3))
plt.plot(x,y1, color='red', linewidth=2)

plt.figure(num=1, figsize=(4,3))
plt.plot(x,y2, color='red')

plt.show()
来源:CSDN
作者:风不二
链接:https://blog.csdn.net/uk_51/article/details/89303845