问题
How to track detailed request time with OkHttp.
I want to get:
- connection time;
- sending time;
- receiving time;
I tried to use Interceptors mechanism, but it provides only total request time.
class LoggingInterceptor implements Interceptor {
  @Override public Response intercept(Chain chain) throws IOException {
    Request request = chain.request();

    long t1 = System.nanoTime();
    logger.info(String.format("Sending request %s on %s%n%s",
        request.url(), chain.connection(), request.headers()));

    Response response = chain.proceed(request);

    long t2 = System.nanoTime();
    logger.info(String.format("Received response for %s in %.1fms%n%s",
        response.request().url(), (t2 - t1) / 1e6d, response.headers()));

    return response;
  }
}

// sample request
String post(String url, String json) throws IOException {

  MediaType JSON = MediaType.parse("application/json; charset=utf-8");
  OkHttpClient client = new OkHttpClient();
  client.networkInterceptors().add(new LoggingInterceptor());

  RequestBody body = RequestBody.create(JSON, json);
  Request request = new Request.Builder()
      .url(url)
      .post(body)
      .build();
  Response response = client.newCall(request).execute();
  return response.body().string();
}
回答1:
There is an implementation of a logging interceptor provided by Square here. It does log the total request time. It also will log the Ok-Http-Sent and Ok-Http-Received headers. I do not know enough of the implementation details to know what those mean, and the documentation is sparse.
I also recommend Facebook's Stetho library. It provides a reasonably detailed view of requests. In particular, it will track "latency" and "time" (neither of which line up with the metrics provided by OkHttp logging). Their implementation of the interceptor may also help you derive your own logging mechanism.
There is a pending stetho issue that discusses adding more detailed information, similar to executing a query in the browser (profiling dns lookup, ssl handshaking, etc), however it looks like it requires (significant?) modifications to OkHttp before being viable.
回答2:
Use response.receivedResponseAtMillis() And response.sentRequestAtMillis() instead
回答3:
- You can use OkHttp Profiler plugin to debug requests directly in the Android studio
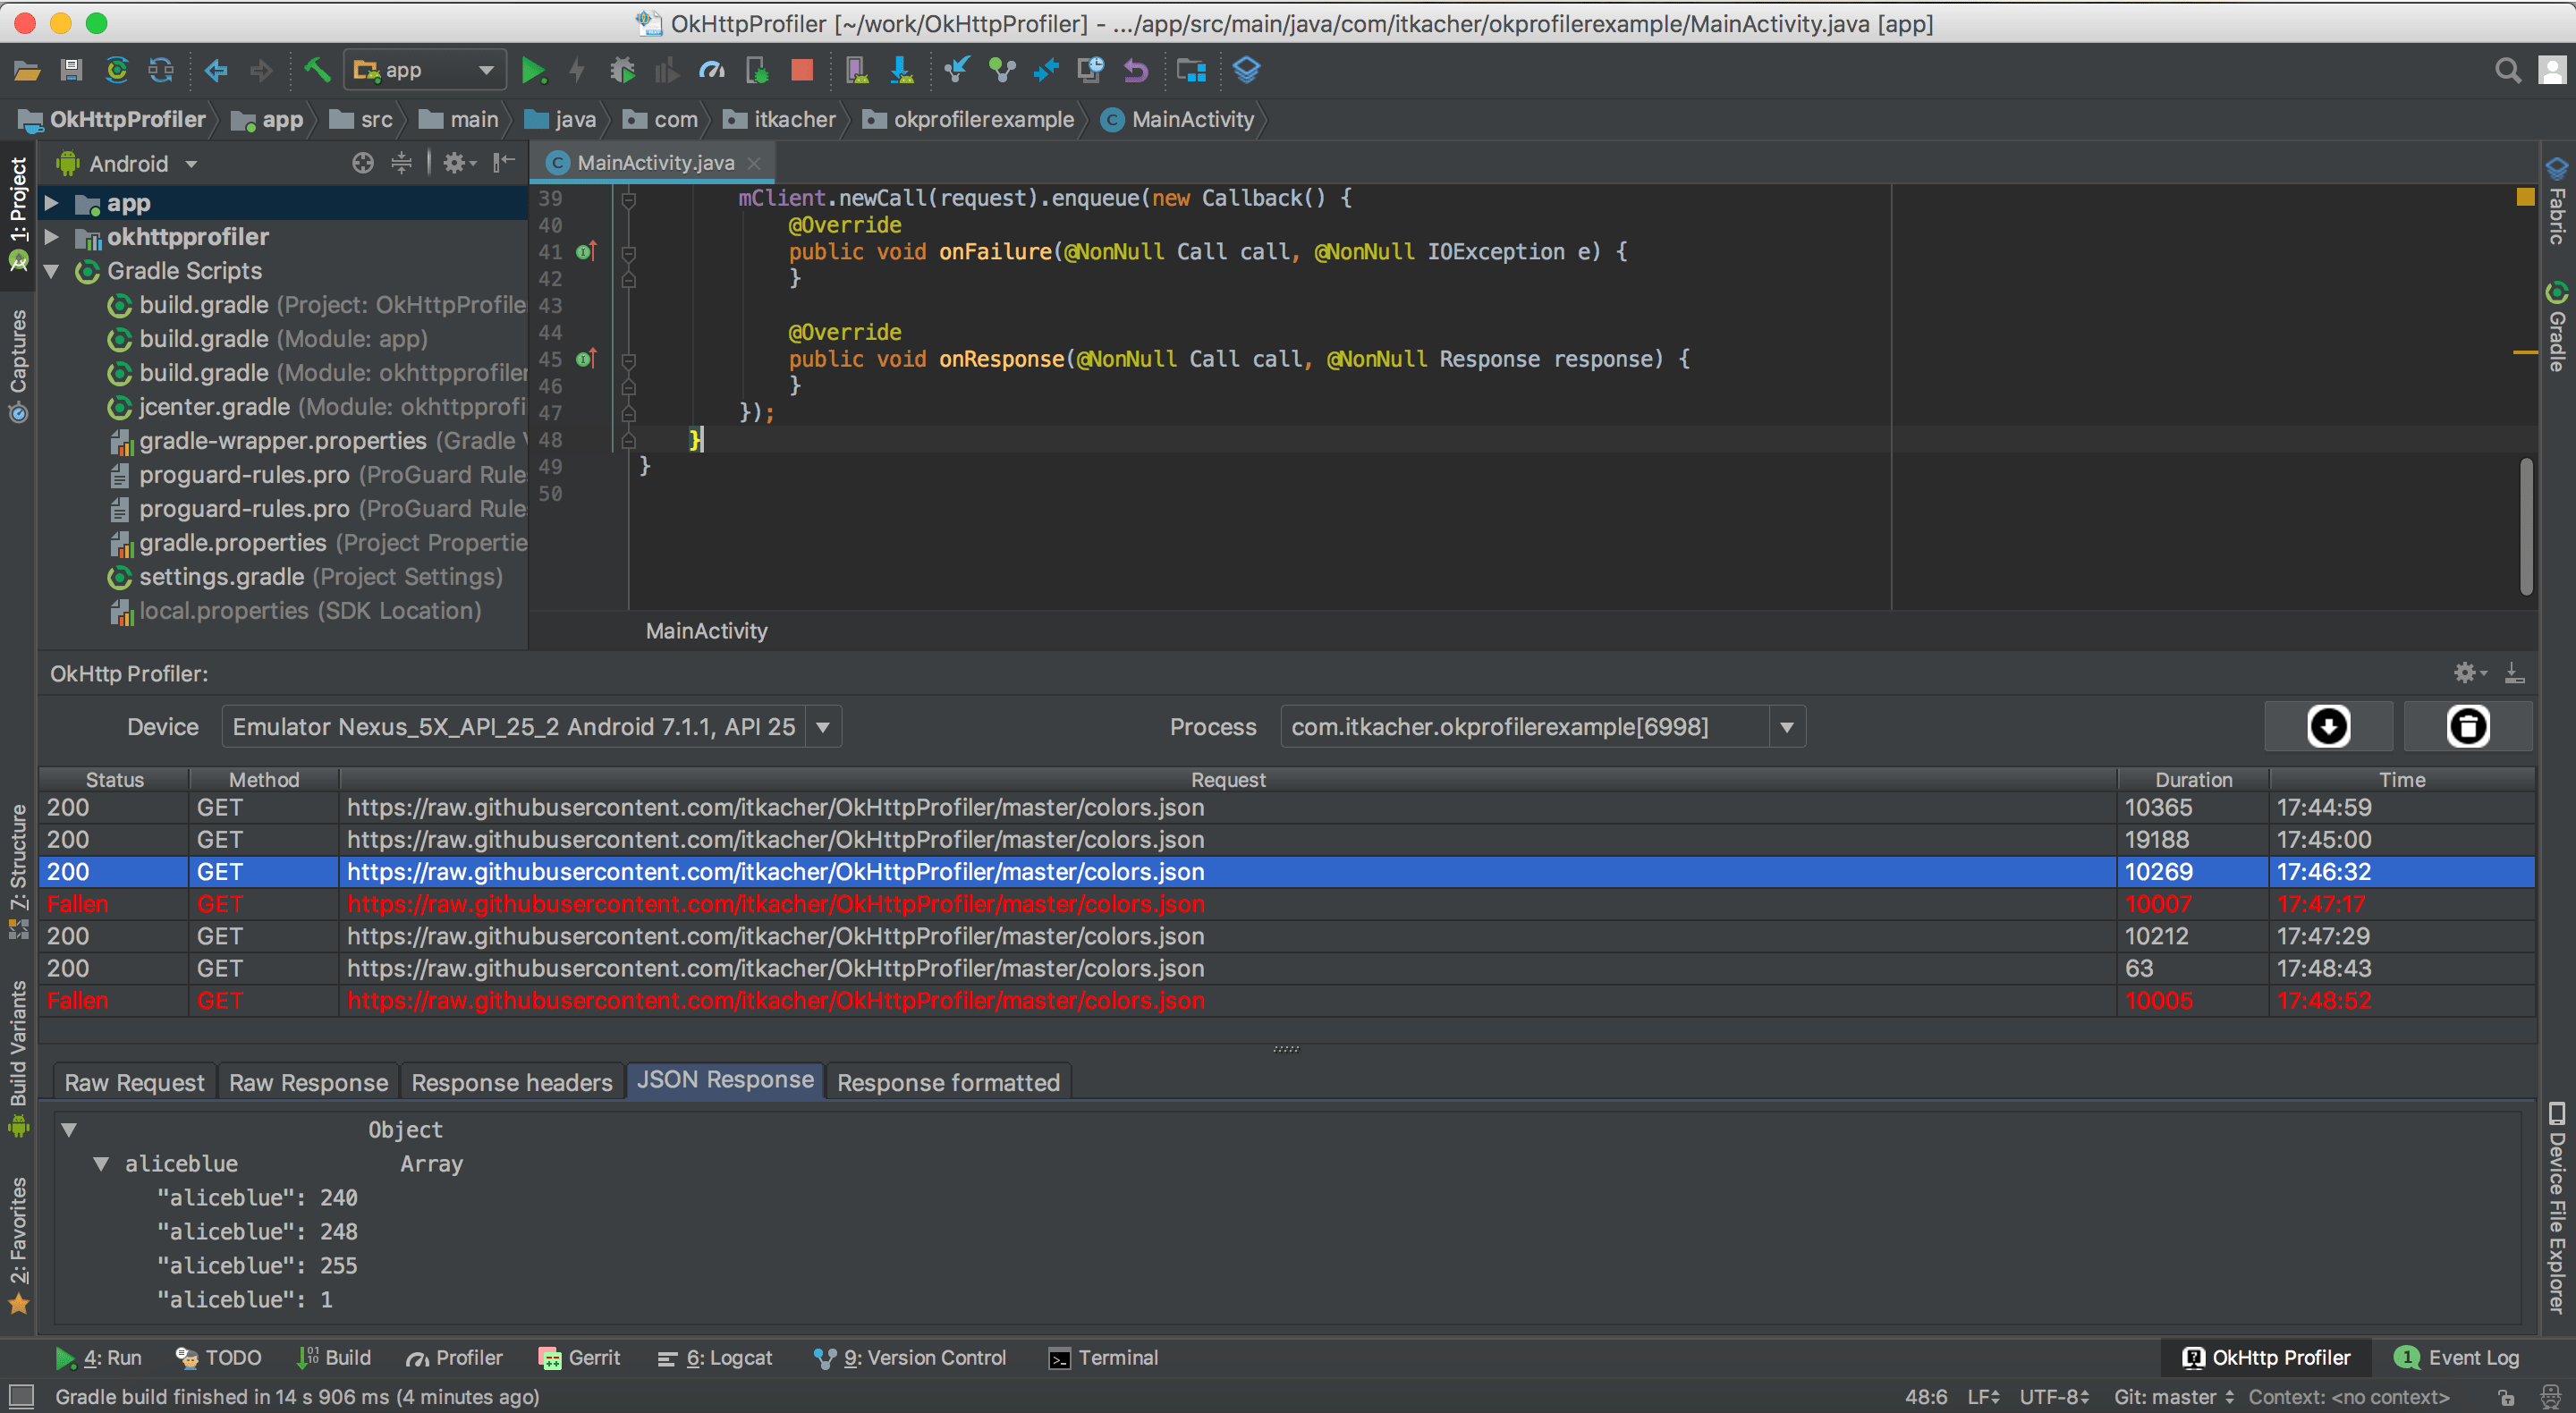
https://github.com/itkacher/OkHttpProfiler
- You can use Charles proxy application
More details about the Charles setup https://link.medium.com/KU8QBMMRjR
来源:https://stackoverflow.com/questions/33625268/profiling-http-request-with-okhttp