问题
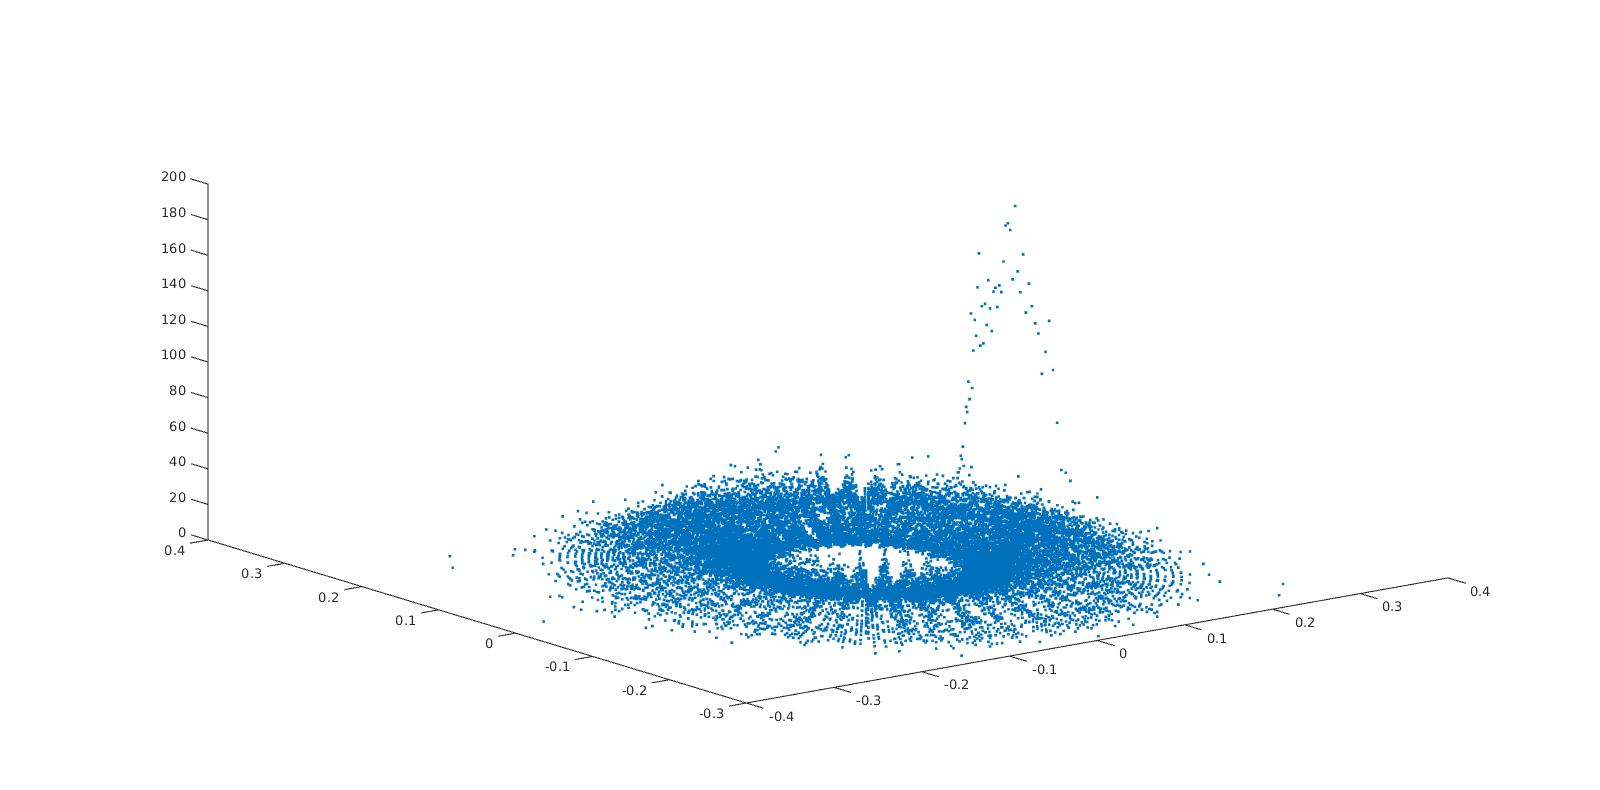
I have a 25000x3-matrix, with each row containing a x-, a y- and a z-value. Now I wanted to do a graphical plot out of these. But for using for example surf(Z) I have to use a mxn-matrix as Z with m equal the size of x and n equal the size of y. How can I reshape the matrix I have to the needed mxn-matrix? The problem is that my x- and y-values are no ints, but floats, so I assume that I have to do a interpolation first. Is that true? My data plotted with plot3 looks like:

回答1:
The fact that your x- and y- values are not integers is not a problem at all. The real question is: are your (x,y) points forming a grid, or not ?
If your points are forming a grid, then you have to reshape your columns to form m-by-n arrays. You may need to
sortyour data according to the first, then second column and then use thereshapefunction.If your points are not forming a grid, then you will have to make an interpolation. By chance the scatterinterpolant class can nicely help you in doing so.
回答2:
As you can see, the data you are providing is neither given in a gridded way, nor is the point cloud clean. You could however try to do the following:
- Project the point cloud onto the x-y plane
- Triangulate those points
- Give the points their original z-coordinate back.
- Plot the surface using trisurf
Here is a MATLAB code that does this:
%// Generate some points P
[X,Y] = ndgrid(0:30);
P = [X(:), Y(:), X(:).^2+Y(:)];
%%// Here the actual computation starts
[~,I] = unique(P(:,1:2),'rows'); %// Remove points with duplicate (x,y)-coords
P = P(I,:);
T = delaunay(P(:,1),P(:,2)); %// Triangulate the 2D-projection
surface = triangulation(T, P(:,1), P(:,2), P(:,3)); %// Project back to 3D
trisurf(surface); %// Plot
You may want to remove stray points first, though.
来源:https://stackoverflow.com/questions/28524289/how-to-create-a-2d-matrix-out-of-my-data-for-surf