问题
I am going to use a binary files (climate variable for the globe ) that can be downloaded from here:
ftp://sidads.colorado.edu/pub/DATASETS/nsidc0301_amsre_ease_grid_tbs/global/
This file is a binary (matrix) file with 586 lines and 1383 columns (global map).
I would like to extract a value that is at 100 longitude and 50 latitude.
I can extract any point using x and y using:
    X<-450 ; Y<-145
    extract<-vector()
file<- readBin(conne, integer(), size=2,  n=586*1383, signed=T)
file2<-t(t(matrix(data=file,ncol=1383,nrow=586)))
extract[file2]<-file2[X,Y]
More info:
These data are provided in EASE-Grid projections global cylindricalat 25 km resolution, are two-
      byte
    Spatial Coordinates:
    N: 90°     S: -90°     E: 180°     W: -180°
But my question is how to know to its lat and long? Any idea pleas
回答1:
I would use the raster package and convert your data to raster objects. Like:
> file<- readBin("ID2r1-AMSRE-ML2010001A.v03.06H", integer(), size=2,  n=586*1383, signed=T)
> m = matrix(data=file,ncol=1383,nrow=586,byrow=TRUE)
> r = raster(m, xmn=-180, xmx=180, ymn=-90, ymx=90)
> plot(r)
Now you have a properly spatially referenced object, but without a full specification of the cylindrical projection used you can't get back to lat-long coordinates.
Longitude is easy, but latitude not so - my use of -90 and +90 probably makes it right at the poles and the equator but not elsewhere. If its a right cylindrical projection then sines and cosines will work it out, but if you have a projection specification in something like PROJ.4 format then there's better ways of doing it.
There some more info here http://nsidc.org/data/ease/tools.html including a link to some grids that have the lat-long of grid cells for that grid system:
ftp://sidads.colorado.edu/pub/tools/easegrid/lowres_latlon/
so for example you can create a raster of latitude for the cells in your data grid:
> lat <- readBin("MLLATLSB",integer(), size=4,  n=586*1383, endian="little")/100000
> latm = matrix(data=lat,ncol=1383,nrow=586,byrow=TRUE)
> latr = raster(latm, xmn=-180, xmx=180, ymn=-90, ymx=90)
> plot(latr)
and then latr[450,123] is the latitude of cell [450,123] in your data. Repeat with MLLONLSB for longitude.
回答2:
Here's how I would go about it.
f <- "ftp://sidads.colorado.edu/pub/DATASETS/nsidc0301_amsre_ease_grid_tbs/global/2002/ID2r1-AMSRE-ML2002170A.v03.06H.gz"
download.file(f, basename(f), mode = "wb")

con <- gzfile(basename(f), open = "rb")
mdat <- readBin(con, integer(), size=2,  n=586*1383, signed=TRUE)
close(con)

mdat <- matrix(data = mdat,ncol=1383,nrow=586,byrow=TRUE)
library(raster)
library(rgdal)
## build a dummy longlat raster and project its extent
## this proj string may not be enough, should be documented though
prj <- "+proj=cea +ellps=WGS84"
ex <- extent(projectExtent(raster(xmn = -180, xmx = 180, ymn = -90, ymx = 90, crs = "+proj=longlat"), prj))

r <- setValues(raster(ex, nrows = 586, ncols = 1383, crs = prj), mdat)
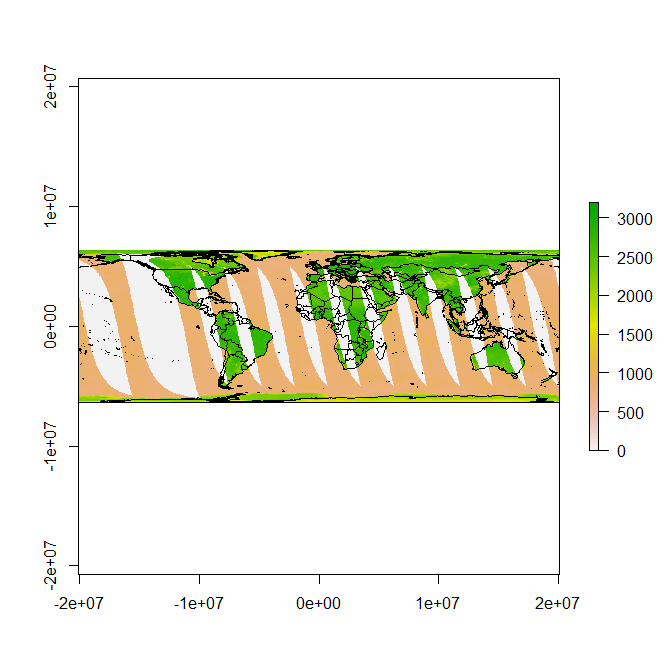
Now we can plot this raster in its native form, and transform other data to it:
library(maptools)
data(wrld_simpl)
plot(r)
plot(spTransform(wrld_simpl, CRS(projection(r))), add = TRUE)
来源:https://stackoverflow.com/questions/20244810/how-to-identify-lat-and-long-for-a-global-matrix