使用TensorFlow的线性回归
本教程是关于通过TensorFlow训练线性模型以适应数据。或者,您可以查看此博客文章。
介绍
在机器学习和统计中,线性回归是对诸如Y的变量和至少一个自变量之间的关系的建模为X.在线性回归中,线性关系将由预测函数建模,其参数将被估计通过数据并称为线性模型。线性回归算法的主要优点是其简单性,使用它可以非常直接地解释新模型并将数据映射到新空间。在本文中,我们将介绍如何使用TensorFLow训练线性模型以及如何展示生成的模型。
整个过程描述
为了训练模型,TensorFlow循环遍历数据,它应该找到适合数据的最佳线(因为我们有一个线性模型)。通过设计适当的优化问题来估计X,Y的两个变量之间的线性关系,其中需求是适当的损失函数。该数据集可从斯坦福大学CS 20SI课程 :TensorFlow for Deep Learning Research获得。
代码实现
通过加载必要的库和数据集来启动该过程:
#斯坦福当然CS 20SI提供的数据文件:TensorFlow深学习研究。 # https://github.com/chiphuyen/tf-stanford-tutorials DATA_FILE = "data/fire_theft.xls" #从.xls文件中读取数据。 book = xlrd.open_workbook(DATA_FILE, encoding_override="utf-8") sheet = book.sheet_by_index(0) data = np.asarray([sheet.row_values(i) for i in range(1, sheet.nrows)]) num_samples = sheet.nrows - 1 ####################### ## Defining flags ##### ####################### tf.app.flags.DEFINE_integer( 'num_epochs', 50, 'The number of epochs for training the model. Default=50') # Store all elements in FLAG structure! FLAGS = tf.app.flags.FLAGS 然后我们继续定义和初始化必要的变量:
# creating the weight and bias. # The defined variables will be initialized to zero. W = tf.Variable(0.0, name="weights") b = tf.Variable(0.0, name="bias") 之后,我们应该定义必要的功能。不同的标签演示了定义的功能:
def inputs(): """ Defining the place_holders. :return: Returning the data and label lace holders. """ X = tf.placeholder(tf.float32, name="X") Y = tf.placeholder(tf.float32, name="Y") return X,Y def inference(): """ Forward passing the X. :param X: Input. :return: X*W + b. """ return X * W + b def loss(X, Y): """ compute the loss by comparing the predicted value to the actual label. :param X: The input. :param Y: The label. :return: The loss over the samples. """ # Making the prediction. Y_predicted = inference(X) return tf.squared_difference(Y, Y_predicted) # The training function. def train(loss): learning_rate = 0.0001 return tf.train.GradientDescentOptimizer(learning_rate).minimize(loss) 接下来,我们将循环遍历不同的数据时代并执行优化过程:
with tf.Session() as sess: # Initialize the variables[w and b]. sess.run(tf.global_variables_initializer()) # Get the input tensors X, Y = inputs() # Return the train loss and create the train_op. train_loss = loss(X, Y) train_op = train(train_loss) # Step 8: train the model for epoch_num in range(FLAGS.num_epochs): # run 100 epochs for x, y in data: train_op = train(train_loss) # Session runs train_op to minimize loss loss_value,_ = sess.run([train_loss,train_op], feed_dict={X: x, Y: y}) # Displaying the loss per epoch. print('epoch %d, loss=%f' %(epoch_num+1, loss_value)) # save the values of weight and bias wcoeff, bias = sess.run([W, b]) 在上面的代码中,sess.run(tf.global_variables_initializer())全局初始化所有已定义的变量。train_op建立在train_loss上,并将在每一步中更新。最后,将返回线性模型的参数,例如wcoeff和bias。为了评估,将演示预测线和原始数据以显示模型如何适合数据:
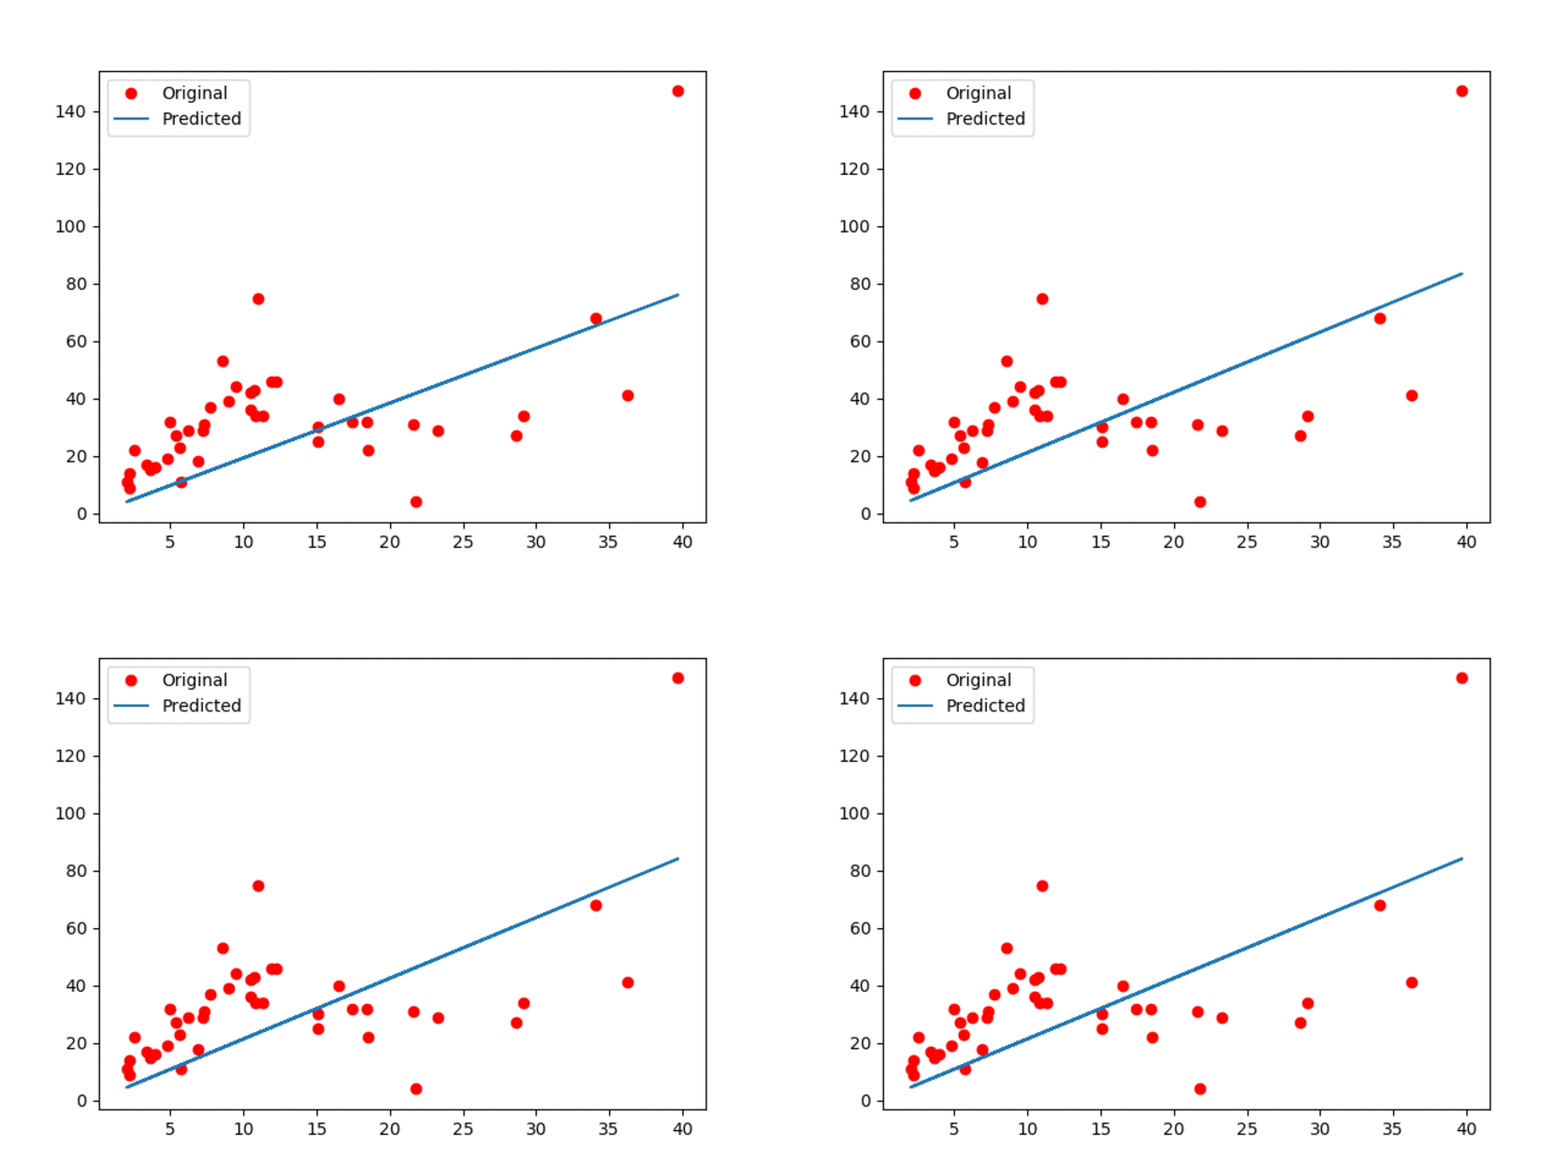
############################### #### Evaluate and plot ######## ############################### Input_values = data[:,0] Labels = data[:,1] Prediction_values = data[:,0] * wcoeff + bias plt.plot(Input_values, Labels, 'ro', label='main') plt.plot(Input_values, Prediction_values, label='Predicted') # Saving the result. plt.legend() plt.savefig('plot.png') plt.close() 结果如下图所示:

图1:原始数据以及估计的线性模型。
上面的动画GIF显示模型带有一些微小的动作,展示了更新过程。可以观察到,线性模型肯定不是最好的!但是,正如我们所提到的,它的简单性是它的优势!
ժҪ
在本教程中,我们使用TensorFlow完成了线性模型创建。训练后发现的线不能保证是最好的线。不同的参数会影响收敛精度。使用随机优化找到线性模型,其简单性使我们的世界变得更容易。