今天是没有头绪的一天,也是学习的一天。
一、准备工作
刚拿过来数据的时候,以前没有做过这个,所以想了半天,goole怎么做数据关联性分析,看了好多博客,有关于关联分析介绍,Apriori(关联分析算法),使用Python做关联分析,特征工程之特征关联,介绍 Scikit-learn几种常用的特征选择方法,利用机器学习预测足球比赛(它的数据要比我们的简单的太多,但是思路不错),基于关联规则的足球比赛数据分析,机器学习里数据预处理及特征工程总结,Pearson相关系数,协方差矩阵、相关矩阵的详细说明,看完这些博客后,自己根据老师的要求,尝试着对数据做了一些处理。
二、分析过程
1、先将数据做了中英文替换(方便后续的结果显示,不然中文乱码)
2、选择Person系数做数据特征之间相关性分析
首先,做胜平负对其他特征的关联度,看哪几个和它的关联度大
然后做赔率(剔除胜平负的特征)关联度分析
最后选取几个大联赛单独做关联度分析
import pandas as pd
import seaborn as sns
import matplotlib.pyplot as plt
import numpy as np

# 使用pearson 系数关联性分析
# 读取数据
f = open('特征提取结果.csv', encoding='UTF-8') # 这里如果使用英文名字A.csv 简化 df = pa.read_csv('A.csv')
df = pd.read_csv(f)

# 将数据列名替换
df.columns = ['League_name','master_averge_5_win','master_averge_5_with','master_average_5_lose',
              'customer_averge_5_win','customer_averge_5_with','customer_average_5_lose',
             'master_master_averge_5_win','master_master_averge_5_with','master_master_average_5_lose',
             'csutomer_customer_averge_5_win','customer_customer_averge_5_with','customer_customer_average_5_lose',
             'master_finally_5_averge_win','master_master_finally_averge_win','customer_customer_finally_5_averge_win',
             'master_previous_finally_win','customer_previous_finally_win','Integral_difference','Poor_ranking',
             'Round_percentage','master_previous_to_now_time','customer_previous_to_now_time',
             'William Hill_win','William Hill_flat','William Hill_lose','bet365_win','bet365_flat','bet365_lose','Ladbrokes_win',
             'Ladbrokes_flat','Ladbrokes_lose','Net victory','Match Results','Total_balls','player_information_left',
             'player_information_right','Win rate','Net difference','master_rate','master_Net difference']
新学习的python 库和函数
corr函数、seaborn 库,Seaborn-Pairplot多变量图
三、出现的问题
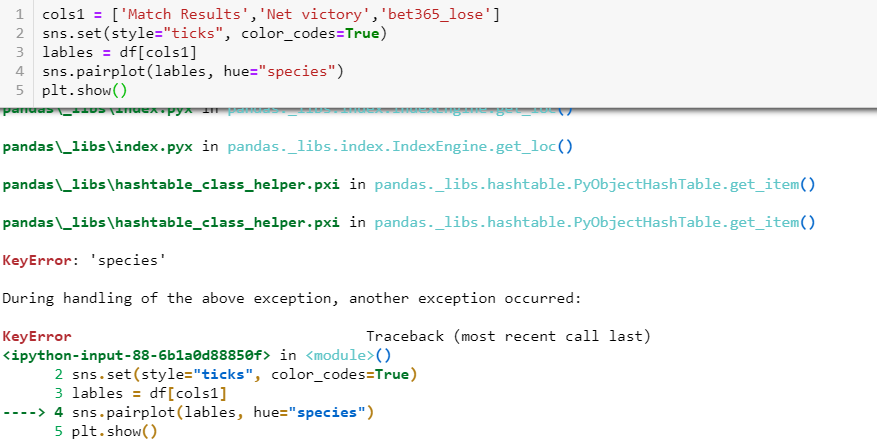
想要绘制不同颜色的散点图的时候,出现了如下问题

来源:oschina
链接:https://my.oschina.net/u/3826747/blog/3028869