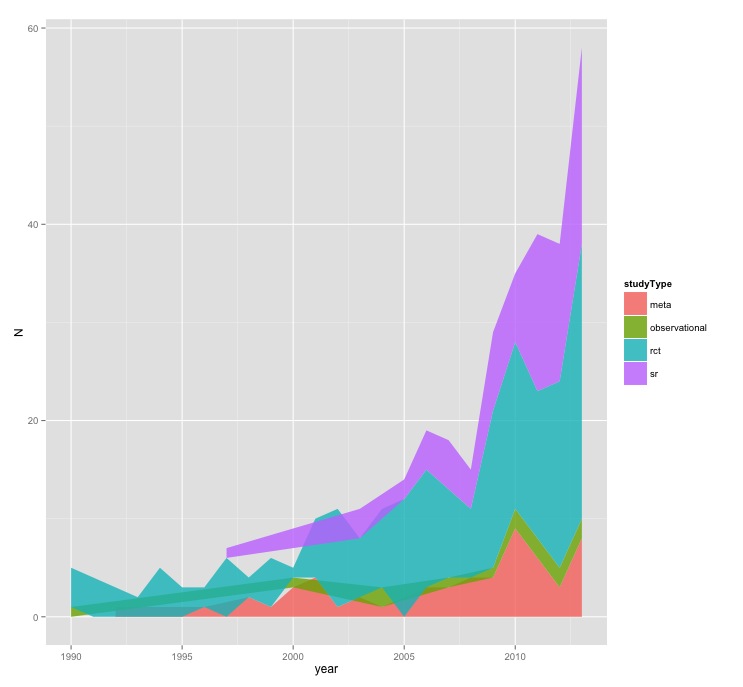
问题
Here is the structure of my data:
Classes ‘tbl_df’, ‘tbl’ and 'data.frame':   60 obs. of  3 variables:
$ year     : num  1990 1990 1991 1992 1993 ...
$ studyType: Factor w/ 4 levels "meta","observational",..: 2 3 3 1 3 3 3 1 3 3 ...
$ N        : int  1 4 4 1 2 5 3 1 2 6 ...
I'm trying to get this into a stacked area chart using the following code:
ggplot(evidence.summary.main, aes(x = year, y = N, fill=studyType)) +
geom_area(alpha=.80)
Any ideas why I cannot get this to stack properly?

And my data from dput:
structure(list(year = c(1990, 1990, 1991, 1992, 1993, 1994, 1995,
1996, 1996, 1997, 1997, 1998, 1998, 1999, 1999, 2000, 2000, 2000,
2001, 2001, 2002, 2002, 2003, 2003, 2003, 2004, 2004, 2004, 2005,
2005, 2006, 2006, 2006, 2007, 2007, 2007, 2007, 2008, 2008, 2008,
2009, 2009, 2009, 2009, 2010, 2010, 2010, 2010, 2011, 2011, 2011,
2011, 2012, 2012, 2012, 2012, 2013, 2013, 2013, 2013), studyType = structure(c(2L,
3L, 3L, 1L, 3L, 3L, 3L, 1L, 3L, 3L, 4L, 1L, 3L, 1L, 3L, 1L, 2L,
3L, 1L, 3L, 1L, 3L, 1L, 3L, 4L, 1L, 2L, 3L, 3L, 4L, 1L, 3L, 4L,
1L, 2L, 3L, 4L, 1L, 3L, 4L, 1L, 2L, 3L, 4L, 1L, 2L, 3L, 4L, 1L,
2L, 3L, 4L, 1L, 2L, 3L, 4L, 1L, 2L, 3L, 4L), .Label = c("meta",
"observational", "rct", "sr"), class = "factor"), N = c(1L, 4L,
4L, 1L, 2L, 5L, 3L, 1L, 2L, 6L, 1L, 2L, 2L, 1L, 5L, 3L, 1L, 1L,
4L, 6L, 1L, 10L, 2L, 6L, 3L, 1L, 2L, 8L, 12L, 2L, 3L, 12L, 4L,
3L, 1L, 9L, 5L, 4L, 7L, 4L, 4L, 1L, 16L, 8L, 9L, 2L, 17L, 7L,
6L, 2L, 15L, 16L, 3L, 2L, 19L, 14L, 8L, 2L, 28L, 20L)), row.names = c(NA,
-60L), .Names = c("year", "studyType", "N"), class = c("tbl_df",
"tbl", "data.frame"))
回答1:
I agree with @untitled that the problem is likely the missing values. I keep thinking there must be a cleaner transformation, but all I could come up with is this
ggplot(as.data.frame(xtabs(N~year+studyType, evidence.summary.main)),
    aes(x = as.numeric(year), y = Freq, fill=studyType)) +
geom_area(alpha=.80)

So I used xtabs() to basically fill in zeros for all the missing year/study combinations.
回答2:
I think there's a slightly more elegant solution which relies on tidyr::complete which is a function that exists solely to fill in missing levels.
evidence.summary.main %>%
    tidyr::complete(year, studyType, fill = list(N = 0)) %>%
    ggplot(aes(x = as.numeric(year), y = N, fill = studyType)) +
    geom_area(alpha = .8)
来源:https://stackoverflow.com/questions/29807080/geom-area-not-stacking-ggplot