问题
I am using R to plot the heat map of a data in CSV file (10 (Columns) Conditions and 1000 (Rowa))
Following is the Code I am using ..
nba <- read.csv("1317754115.csv", sep=",")
nba_matrix <- data.matrix(nba)
cexRow = 0.2 + 1/log10(1000),
cexCol = 0.2 + 1/log10(10),
nba_heatmap <- heatmap(nba_matrix, Rowv=cexRow, Colv=cexCol,
    col = heat.colors(256), scale="column", margins=c(5,10))
 Heat Map Image
Now Rows on right hand sides are very close so I can not read the label names ,
Can some one please tell me how can i show all labels on Y-Axis
Thanks
回答1:
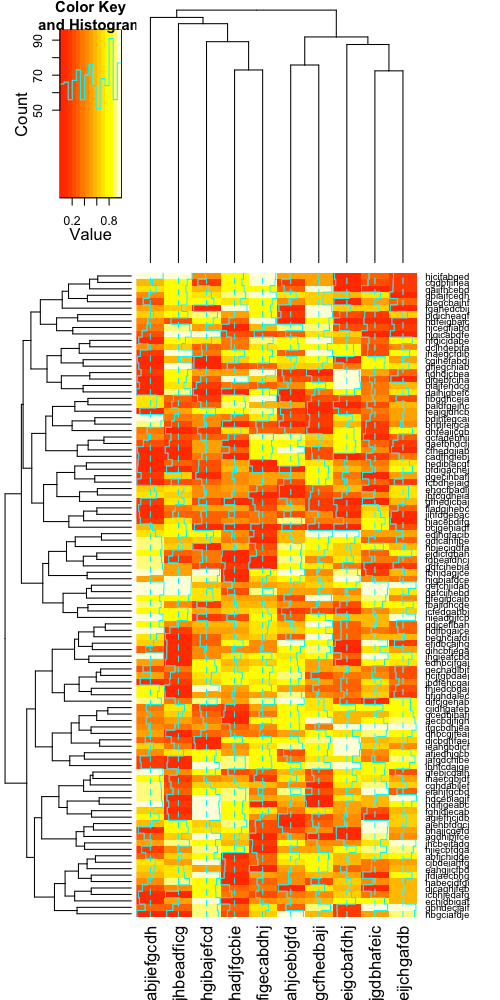
You can't change the aspect ratio with the base heatmap function. To get this functionality, see heatmap.2 in the gplots package, or aspectHeatmap in the ClassDiscovery package. Here's an example:
require(gplots)

nrow = 100
ncol = 10

set.seed(12345)
row.names = replicate(nrow, paste(letters[sample(10)], collapse=''))
col.names = replicate(ncol, paste(letters[sample(10)], collapse=''))

values = matrix(runif(nrow*ncol), nrow=nrow, dimnames=list(row.names, col.names))

dev.new(width=5, height=10)
heatmap(values)
dev.new(width=5, height=10)
heatmap.2(values)


来源:https://stackoverflow.com/questions/7655034/r-heat-map-labels-on-y-axis-coming-out-to-be-very-close