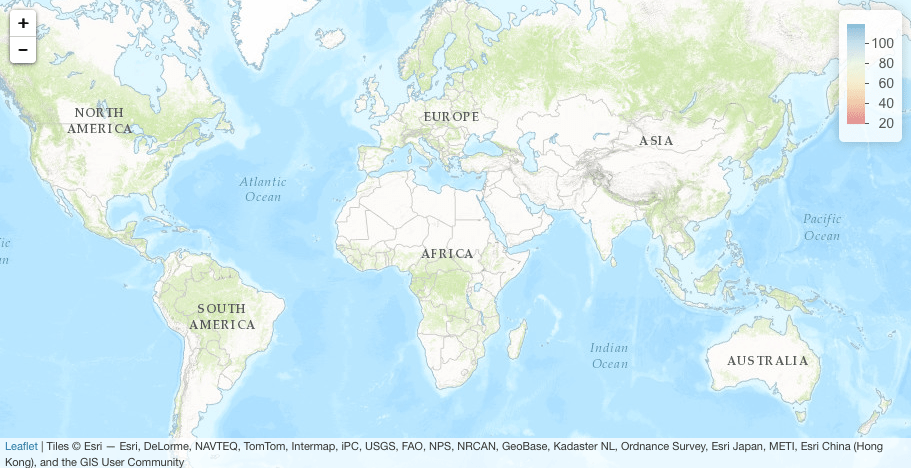
I am trying to reverse the value display of my leaflet legend in R. This post covers categorical data, but I am working with continuous data. Here's a toy example:
map <- leaflet() %>% addProviderTiles('Esri.WorldTopoMap')
x <- 1:100
pal <- colorNumeric(c("#d7191c","#fdae61","#ffffbf","#abd9e9", "#2c7bb6"), x)
map %>% addLegend('topright', pal=pal, values=x)
I'd like the legend to read 100 at the top and 1 on the bottom with the colors reversed. I can certainly reverse the colors in colorNumeric(), but reversing the order of the labels is harder. I have tried reversing the order of the values in x, and I even fiddled with the labelFormat() parameter for addLegend() to reference a lookup table of reversed values... nothing seems to work. Is there an easy way to do this?
Unfortunately the accepted answer to this will get the numbers out of alignment (in fact exactly reversed) from the colours they represent.
Here's the original proposed solution, which I say is incorrect:
map <- leaflet() %>% addProviderTiles('Esri.WorldTopoMap')
x <- 1:100
pal <- colorNumeric(c("#d7191c","#fdae61","#ffffbf","#abd9e9", "#2c7bb6"), x)
map %>% addLegend('topright', pal=pal, values=x)

# This solution shows 100 as red
map %>% addLegend('topright',
                  pal = pal,
                  values = x,
                  labFormat = labelFormat(transform = function(x) sort(x, decreasing = TRUE)))
But if you've been using the pal() function to draw anything on your map, you now have it exactly wrong.
# But 100 is blue, not red
plot(1, 1, pch = 19, cex = 3, col = pal(100))
I think the solution is to define to functions that allocate colours to numbers, one in reverse for the legend, and one for actually drawing things:
pal_rev <- colorNumeric(c("#d7191c","#fdae61","#ffffbf","#abd9e9", "#2c7bb6"), x, reverse = TRUE)

map %>% addLegend('topright',
                  pal = pal_rev,
                  values = x,
                  labFormat = labelFormat(transform = function(x) sort(x, decreasing = TRUE)))
This gives us a legend that matches anything we will have drawn ie 100 is now correctly shown to be blue:
I just found that the built-in labelFormat function has a transform parameter that takes a function. So I passed the sort function in there.
To use the same example,
map %>% addLegend('topright',
              pal = pal,
              values = x,
              labFormat = labelFormat(transform = function(x) sort(x, decreasing = TRUE)))
Update
Use the answer by Jake. This one should no longer be the 'accepted' one.
I have a feeling there's a simpler way. However, taking my solution from this other question you can create your own label format and use that
However, you may want to play with the cuts as it leaves the space above 100
library(leaflet)

map <- leaflet() %>% addProviderTiles('Esri.WorldTopoMap')

x <- 1:100
## I've reversed the order of the colours too
pal <- colorNumeric(rev(c("#d7191c","#fdae61","#ffffbf","#abd9e9", "#2c7bb6")), x)

## custom label format function
myLabelFormat = function(..., reverse_order = FALSE){
    if(reverse_order){
        function(type = "numeric", cuts){
            cuts <- sort(cuts, decreasing = T)
        }
    }else{
        labelFormat(...)
    }
}

map %>% addLegend('topright',
                  pal = pal,
                  values = x,
                  labFormat = myLabelFormat(reverse_order = T))
来源:https://stackoverflow.com/questions/40276569/reverse-order-in-r-leaflet-continuous-legend


