Fill OUTSIDE of polygon | Mask array where indicies are beyond a circular boundary?
I use plot(x,y,\'r\') to plot a red circle. x and y are arrays such that when paired as (x,y) and plotted, all points form a circle-line.
fill(x,y
-
Note: This answer uses MATLAB syntax, since the question was originally tagged as such. However, even if you're using matplotlib in Python the concept should be the same even if the syntax is slightly different.
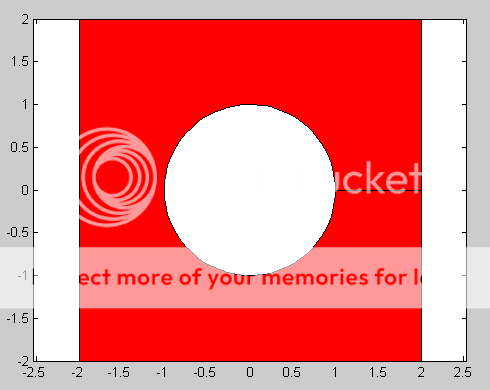
One option you have is to make a polygon that appears to have a hole in it, but really just has two of its edges wrapping around an empty space and touching. You can do this by creating a set of
xandycoordinates that track around the edge of the circle, then track from the circle edge to the edge of a bounding square, then track around the edge of that square and back to the circle edge along the same line. Here's an example with a unit circle and a 4 by 4 square centered at the origin:theta = linspace(0,2*pi,100); %# A vector of 100 angles from 0 to 2*pi xCircle = cos(theta); %# x coordinates for circle yCircle = sin(theta); %# y coordinates for circle xSquare = [2 2 -2 -2 2 2]; %# x coordinates for square ySquare = [0 -2 -2 2 2 0]; %# y coordinates for square hp = fill([xCircle xSquare],... %# Plot the filled polygon [yCircle ySquare],'r'); axis equal %# Make axes tick marks equal in sizeAnd here is the figure you should see:

Notice the line on the right joining the edges of the circle and square. This is where two edges of the red polygon meet and touch each other. If you don't want the edge lines to be visible, you can change their color to be the same as the fill color for the polygon like so:
set(hp,'EdgeColor','r');
- 热议问题

 加载中...