本文分享自微信公众号 - 大数据建模笔记(bigdatamodeling)
本文主要介绍python已有模块中模型评估指标的使用,主要有sklearn.metrics、scikitplot.skplt等方法,并且重点展示分类模型的常用的几个评估指标。
载入数据
加载breast-cancer数据集:
# 加载数据
import pandas as pd
import matplotlib.pyplot as plt
from collections import Counter

df = pd.read_csv('https://archive.ics.uci.edu/ml/machine-learning-databases/breast-cancer-wisconsin/wdbc.data',header=None)

Xvar = ['X'+str(i) for i in list(range(1, 31))]
var= ['id', 'y'] + Xvar
df.columns = var

Counter(df['y'])
df['y'] = df['y'].map({'M': 1, 'B': 0})
df.info()

X = df.loc[:, Xvar].values
y = df['y'].values
抽样
抽样如下:
# 抽样
from sklearn.model_selection import train_test_split
X_train, X_test, y_train, y_test = train_test_split(X, y, test_size=0.20, random_state=1)
标准化
对X变量做标准化处理:
# 标准化
from sklearn.preprocessing import StandardScaler
scaler = StandardScaler().fit(X_train)
X_train = scaler.transform(X_train)
X_test = scaler.transform(X_test)
建立模型并预测数据
以随机森林为例:
# 预测
from sklearn.ensemble import RandomForestClassifier
rf = RandomForestClassifier(n_estimators=300, max_depth=3, random_state=1234)
rf = rf.fit(X_train, y_train)

y_pred = rf.predict(X_test)
y_prob = rf.predict_proba(X_test)
y_prob_1 = rf.predict_proba(X_test)[:, 1]
y_prob_0 = rf.predict_proba(X_test)[:, 0]
混合矩阵
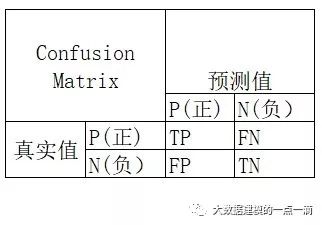
混合矩阵或称为混淆矩阵,是机器学习中总结分类模型预测结果的情形分析表,以矩阵形式将数据集中的记录按照真实的类别与预测的类别进行汇总。其中矩阵的行表示真实值,矩阵的列表示预测值,以二分类为例,看下矩阵表现形式:

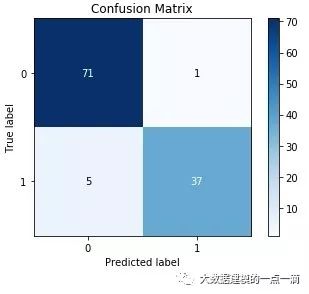
1、sklearn.metrics模块中的confusion_matrix方法,可以直接求出混合矩阵:
from sklearn.metrics import confusion_matrix
confmat = confusion_matrix(y_true=y_test, y_pred=y_pred)
print(confmat)
# 混合矩阵为:
[[71 1]
 [ 5 37]]
2、上面得到的结果展示的较简单,可以使用scikitplot.skplt中的方法得到更好看的结果:
import scikitplot as skplt
skplt.metrics.plot_confusion_matrix(y_test, y_pred)

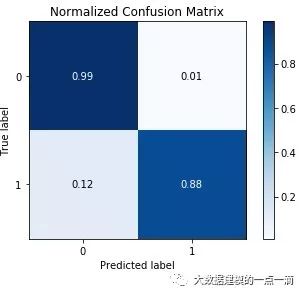
下面是混合矩阵的比例形式:
skplt.metrics.plot_confusion_matrix(y_test, y_pred, normalize=True)

查准率/准确率、查全率/召回率
1、根据混合矩阵可以计算出查准率/准确率、查全率/召回率等指标:
from sklearn.metrics import precision_score, recall_score, f1_score

# 查准率/准确率Precision(PRE) = TP/(TP+FP)
precision_score(y_true=y_test, y_pred=y_pred) # 0.9736842105263158

# 查全率/召回率recall(REC) = TP/(TP+FN)
recall_score(y_true=y_test, y_pred=y_pred) # 0.8809523809523809

# F1 = 2*PRE*REC/(PRE+REC)
f1_score(y_true=y_test, y_pred=y_pred) # 0.925
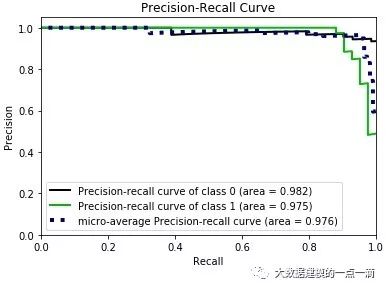
2、画出准确率-召回率曲线(Precision-Recall Curve),曲线下面区域面积越大,模型越好。
import scikitplot as skplt
skplt.metrics.plot_precision_recall_curve(y_test, y_prob)

正确率/误分类率
正确率是指模型预测正确的数量(包含正样本和负样本)占总样本数量比例。
from sklearn.metrics import accuracy_score
accuracy_score(y_true=y_test, y_pred=y_pred) # 0.9473684210526315
性能提取报告
sklearn.metrics中的classification_report可以提取模型的性能报告,其实就是将准确率、召回率等指标打印成报告的形式输出。
from sklearn.metrics import classification_report
print(classification_report(y_true=y_test, y_pred=y_pred))
报告如下:

AUC值
1、sklearn.metrics中的roc_auc_score可以直接计算出AUC值:
from sklearn.metrics import roc_auc_score
roc_auc_score(y_true=y_test, y_score=y_prob_1) # 0.9761904761904762
2、可以使用scikitplot.skplt画出ROC曲线:
import scikitplot as skplt
skplt.metrics.plot_roc(y_test, y_prob)
效果如下:

其他的模型评估指标,请戳下面链接:
本文分享自微信公众号 - 大数据建模笔记(bigdatamodeling)。
如有侵权,请联系 support@oschina.cn 删除。
本文参与“OSC源创计划”,欢迎正在阅读的你也加入,一起分享。
来源:oschina
链接:https://my.oschina.net/u/3869506/blog/4376244