相信很多具有一定Python基础的人应该都发现了,用matplotlib库绘制出来的可视化图形,除了面积图之外,都略丑(默认的)!但是,用pyecharts库作出来的可视化图形,则具有很强的视觉冲击力!
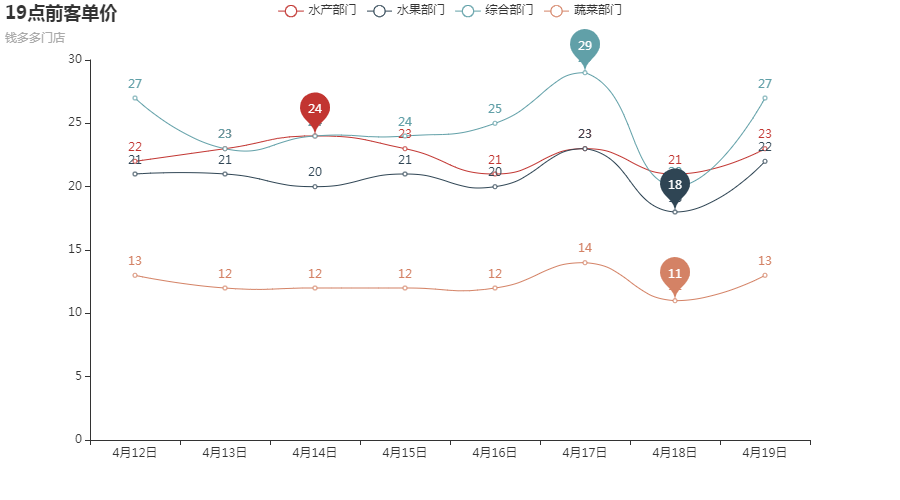
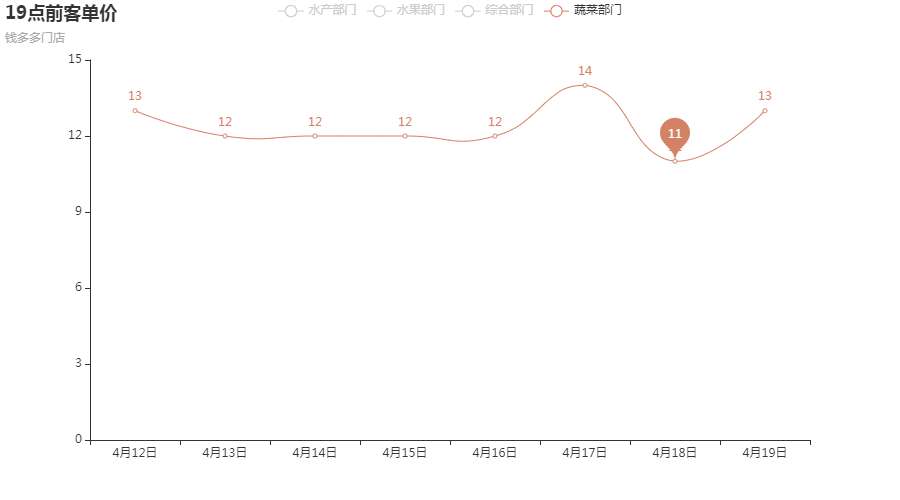
下面是同事嫌弃Excel作出来的折线图不够好看,就让我用Python代画的一组折线。话不多说,具体代码与结果如下:
# 客单
from pyecharts.charts import Line
from pyecharts import options as opts


cate = ["4月12日","4月13日","4月14日","4月15日","4月16日","4月17日","4月18日","4月19日"]
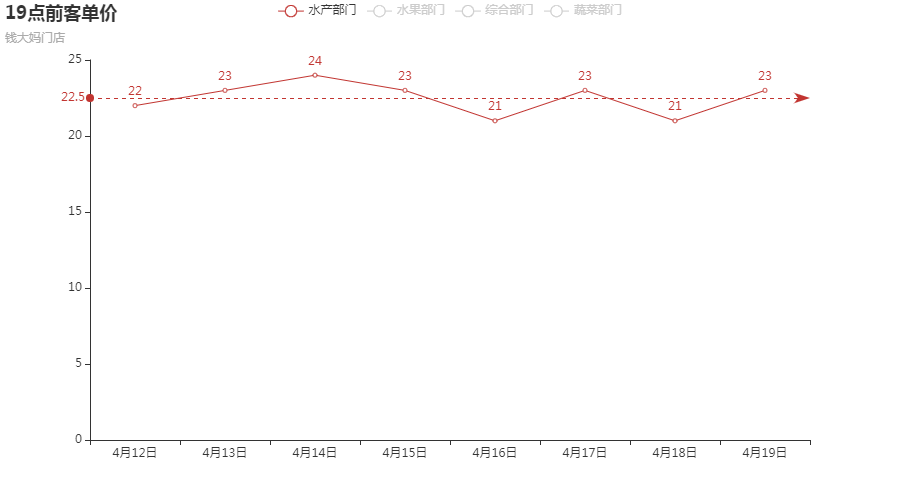
fish = [22,23,24,23,21,23,21,23]
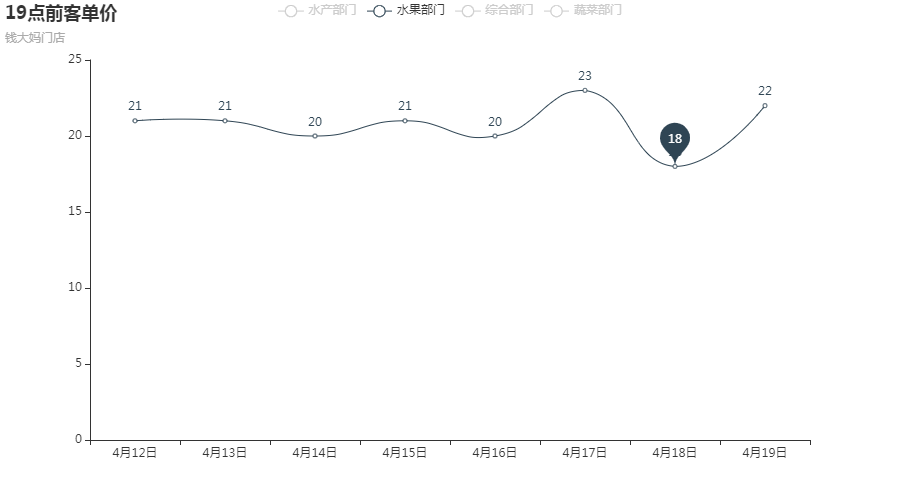
fruit = [21,21,20,21,20,23,18,22]
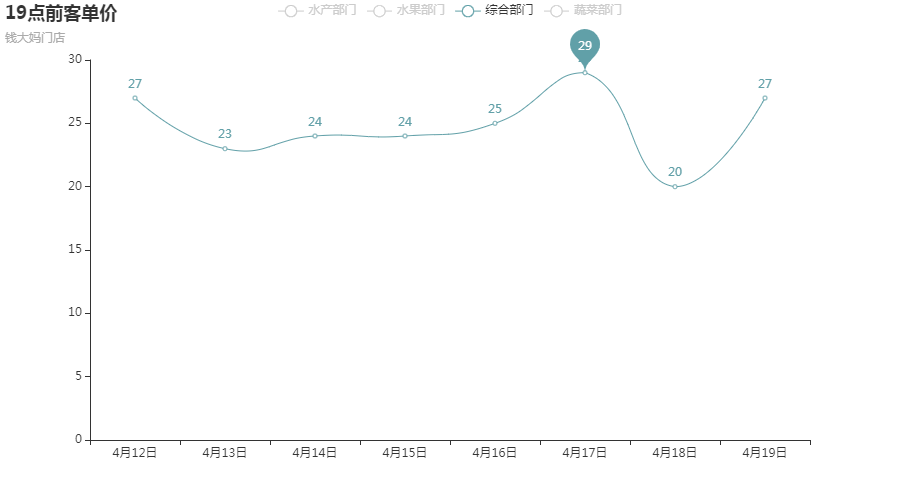
others = [27,23,24,24,25,29,20,27]
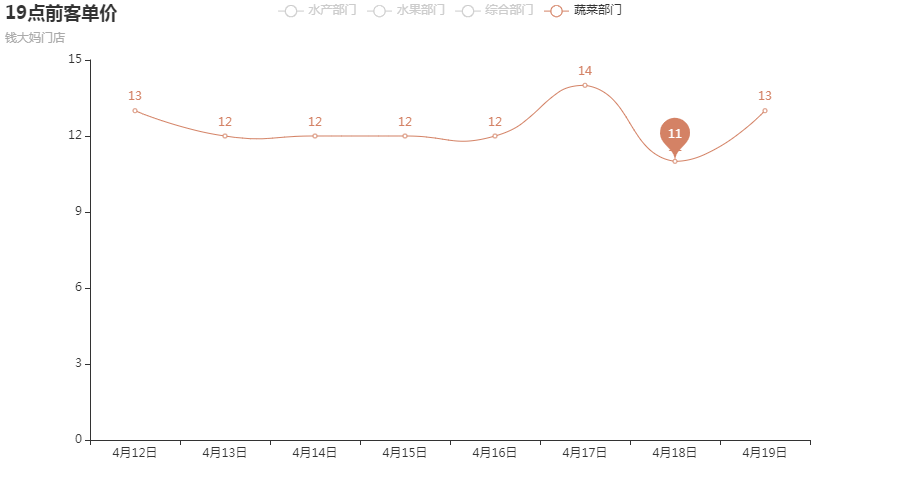
vegetable = [13,12,12,12,12,14,11,13]


line = (Line()
       .add_xaxis(cate)
       .add_yaxis("水产部门", fish,
                  is_smooth=True,
                  markpoint_opts=opts.MarkPointOpts(data=[opts.MarkPointItem(name="最高价",
                                                                             coord=[cate[2], fish[2]], value=fish[2])]))

       .add_yaxis("水果部门", fruit,
                  is_smooth=True,
                  markpoint_opts=opts.MarkPointOpts(data=[opts.MarkPointItem(name="最低价",
                                                                             coord=[cate[6], fruit[6]], value=fruit[6])]))

       .add_yaxis("综合部门", others,
                  is_smooth=True,
                  markpoint_opts=opts.MarkPointOpts(data=[opts.MarkPointItem(name="最高价",
                                                                             coord=[cate[5], others[5]], value=others[5])]))

        .add_yaxis("蔬菜部门", vegetable,
                  is_smooth=True,
                  markpoint_opts=opts.MarkPointOpts(data=[opts.MarkPointItem(name="最低价",
                                                                             coord=[cate[6], vegetable[6]], value=vegetable[6])]))

       .set_global_opts(title_opts=opts.TitleOpts(title="19点前客单价", subtitle="钱多多门店"))
      )

line.render_notebook()
全图:
子图一:
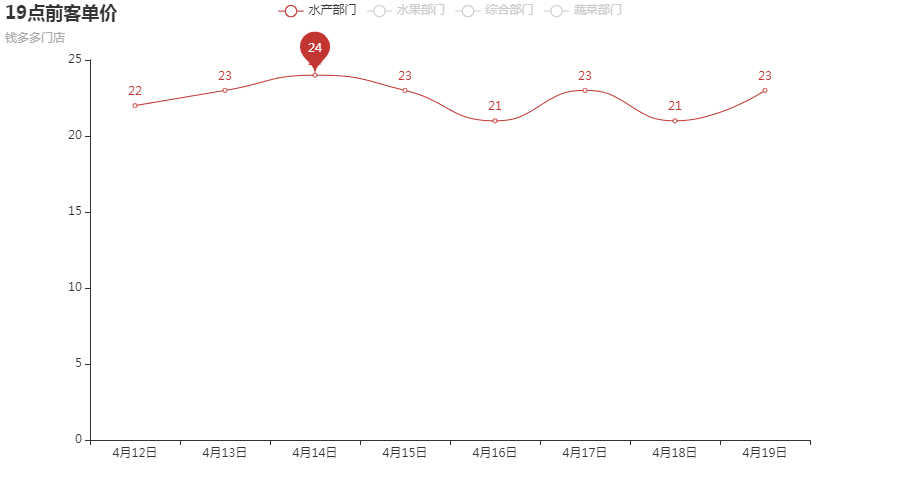
子图二:
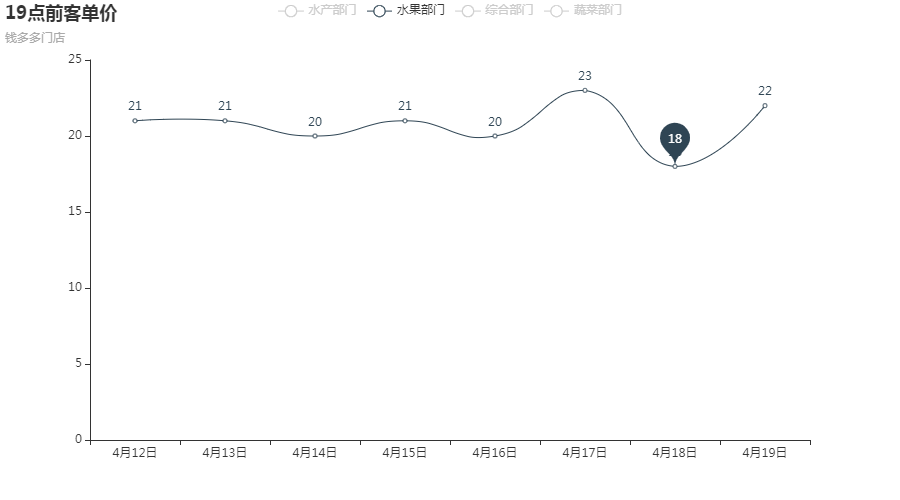
子图三:
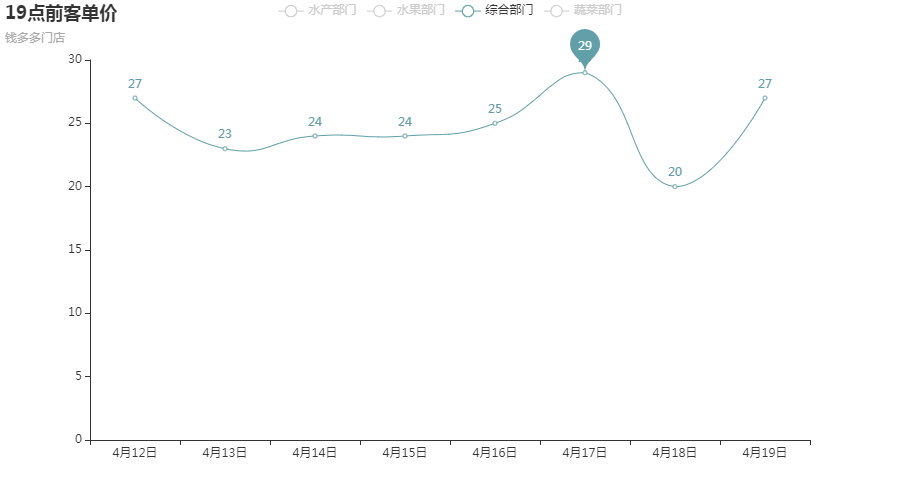
子图四:
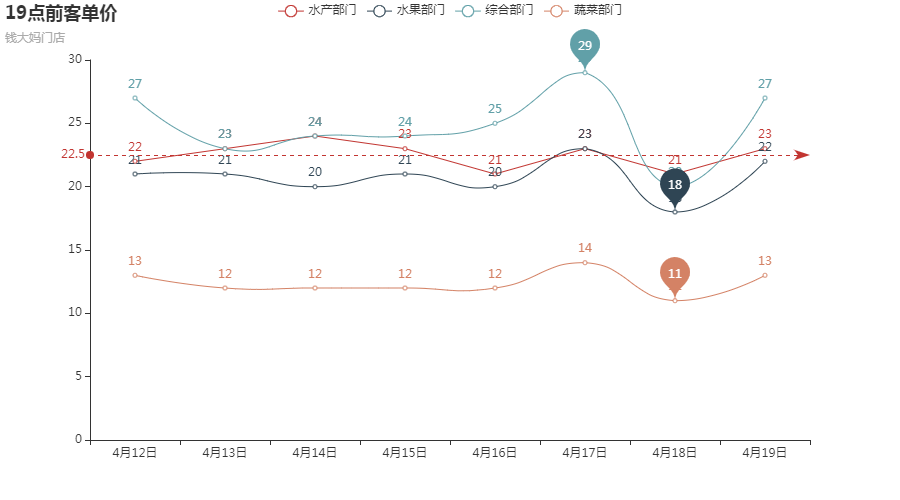
再来一个兼具折线与平滑线的混合图:
# 客单
from pyecharts.charts import Line
from pyecharts import options as opts


cate = ["4月12日","4月13日","4月14日","4月15日","4月16日","4月17日","4月18日","4月19日"]
fish = [22,23,24,23,21,23,21,23]
fruit = [21,21,20,21,20,23,18,22]
others = [27,23,24,24,25,29,20,27]
vegetable = [13,12,12,12,12,14,11,13]
"""
折线图示例:
1. is_smooth 折线 OR 平滑
2. markline_opts 标记线 OR 标记点
"""
line = (Line()
       .add_xaxis(cate)
       .add_yaxis("水产部门", fish,
                  markline_opts=opts.MarkLineOpts(data=[opts.MarkLineItem(type_="average")]))

       .add_yaxis("水果部门", fruit,
                  is_smooth=True,
                  markpoint_opts=opts.MarkPointOpts(data=[opts.MarkPointItem(name="最小值",
                                                                             coord=[cate[6], fruit[6]], value=fruit[6])]))

       .add_yaxis("综合部门", others,
                  is_smooth=True,
                  markpoint_opts=opts.MarkPointOpts(data=[opts.MarkPointItem(name="最大值",
                                                                             coord=[cate[5], others[5]], value=others[5])]))

        .add_yaxis("蔬菜部门", vegetable,
                  is_smooth=True,
                  markpoint_opts=opts.MarkPointOpts(data=[opts.MarkPointItem(name="最大值",
                                                                             coord=[cate[6], vegetable[6]], value=vegetable[6])]))

       .set_global_opts(title_opts=opts.TitleOpts(title="19点前客单价", subtitle="钱大妈门店"))
      )

line.render_notebook()
全图:
子图一:
子图二:
子图三:
子图四:
由此可见,掌握pyecharts可视化比掌握matplotlib可视化更具有装逼效果!
来源:oschina
链接:https://my.oschina.net/u/3750423/blog/3420872