问题
#include <vector>
#include <cmath>
#include <boost/tuple/tuple.hpp>
#include "gnuplot-iostream.h"

int main()
{
    float frame[4][4];
    for (int n=0; n<4; n++)
    {
        for (int m=0; m<4; m++)
        {
        frame[n][m]=n+m;
        }
    }
    Gnuplot gp;
    gp << "unset key\n";
    gp << "set pm3d\n";
    gp << "set hidden3d\n";
    gp << "set view map\n";
    gp << "set xrange [ -0.500000 : 3.50000 ] \n";
    gp << "set yrange [ -0.500000 : 3.50000 ] \n";
    gp << "splot '-'\n";
    gp.send2d(frame);
    gp.flush();
}
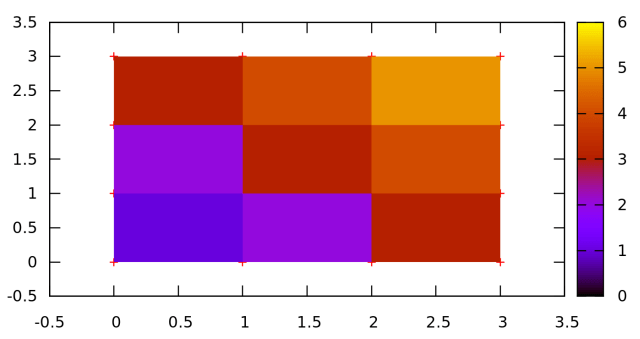
This generates me an image:

The problem is, that element "frame[0][0]" should be black in this color palette. And I suppose it is black, but the area between four points is colored in blue (color for average value of these four points). What I want, that I could generate an image like this: link to gnuplot heatmap example. It actually colors a matrix element, not the area between four elements. So how do I do that using C++ and an iostream pipe? I can print data to a file and then plot from that file, but this can be slow... Any ideas?
回答1:
You must use the image plotting style, just like done in the demo page you linked:
#include <vector>
#include <cmath>
#include <boost/tuple/tuple.hpp>
#include "gnuplot-iostream.h"

int main()
{
    float frame[4][4];
    for (int n=0; n<4; n++)
    {
        for (int m=0; m<4; m++)
        {
        frame[n][m]=n+m;
        }
    }
    Gnuplot gp;
    gp << "unset key\n";
    gp << "set autoscale fix\n";
    gp << "plot '-' with image\n";
    gp.send2d(frame);
    gp.flush();
}
I cannot test it right now, but that should do the trick. Maybe you need to change the set autoscale part to fit your needs. Using set autoscale fix uses tight ranges for all axes (x, y, and color).
来源:https://stackoverflow.com/questions/26777605/plotting-heatmap-with-gnuplot-in-c