问题
I have the following report:

In Excel I'd use something called Freeze Pane below the chart ....this would mean as the user scrolls down, the table will scroll, but the chart would always remain visible.
Is it possible to implement this behavior in RS?
EDIT
Note: the chart and the tablix use different Datasets
回答1:
Yes, you can get this going with a bit of tweaking.
With Tablix objects, you have the option to fix header rows, i.e. they will stay at the top of the page when scrolling.
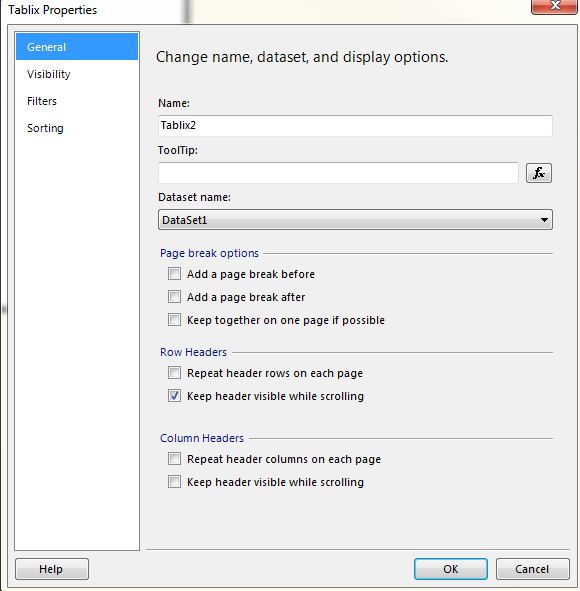
You can set this at the Tablix level:

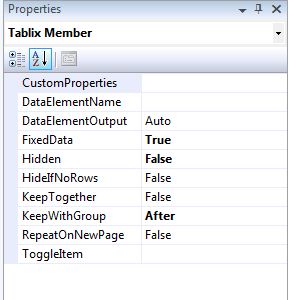
Or at the row level with Advanced Mode set by using the FixedData property:


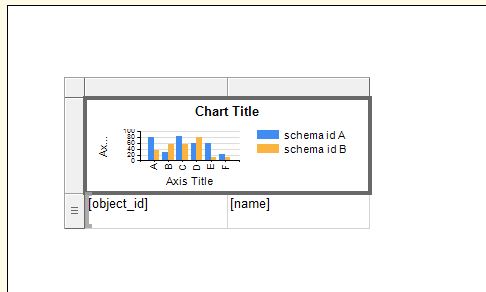
So what you can do to take advantage of this is to insert a Chart into those repeating Header rows. I tested this with a basic report:

This did succeed in having the Chart scroll with the Tablix, so will fulfil your requirements. One warning - it didn't look good when I did this (overlapping cells and the like), but it was a report with zero formatting so hopefully this will be helpful for you, anyway.
Edit after comment:
In my simple report example I added a new Dataset to the report, and pointed the embedded Chart to this new Dataset - this didn't work, as every time I did this it would always revert to the old Dataset (i.e. the one specified at the Tablix level).
However, what you can do instead is use a Subreport, which contains the required Chart, and embed this Subreport in the Tablix header. I just tried it now and it worked as required; the Chart using the second Dataset was fine and it scrolled with the Tablix as required.
So it's still a viable option with multiple Datasets, you just need the extra step of using a Subreport:
New report:

Subreport:

来源:https://stackoverflow.com/questions/15065843/can-i-force-a-chart-at-the-top-of-a-report-to-always-be-visible