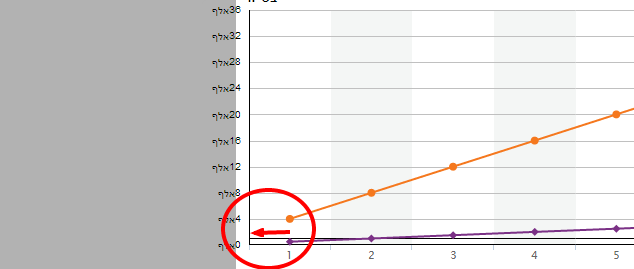
问题
Is it possible to start the line from the hinges base ?
I have looked everywhere and couldnt find a solution for it
here is my code
jQuery('#chart').highcharts({
        colors: ['#f5781e', '#7b3186'],
        navigation: {
            buttonOptions: {
                enabled: false
            }
        },
        credits: {
            enabled: false
        },
        chart: {
            type: 'line',
            marginRight: 0,
            marginBottom: 35,
            width: 700,
            height: 280,
        },
        title: {
            text: '',
            x: -20 //center
        },
        subtitle: {
            text: '',
            x: -20
        },
        xAxis: {
            categories: ['1','2','3','4','5','6','7','8'],
            alternateGridColor: '#f4f6f5',
            lineColor: '#000000',
            lineWidth: 1,
            min: 0,
        },
        yAxis: {
            title: {
                text: ''
            },
            labels: {
                useHTML : true,
                format: '<span class="axis"><span class="flright">{value}</span>אלף</span>'
            },
            tickInterval: 3,
            max: 35.2,
            plotLines: [{
                value: 1,
                width: 1,
                color: '#000'
            }],

            lineColor: '#000000',

            lineWidth: 1,
            min: 0
        },
        plotOptions: {
            series: {
                pointStart: 0
            }
        },
        tooltip: {
            crosshairs: {
                width: 2,
                color: 'gray',
                dashStyle: 'shortdot'
            },
            animation: true,
            valueSuffix: ',000₪',
            backgroundColor: 'rgba(255, 255, 255, 0.8)',
            formatter: function() {return '<b>₪' + this.x + this.y +'</b>';}
        },
        legend: {
            enabled: false
            /*****************
            layout: 'horizontal',
            align: 'center',
            verticalAlign: 'bottom',
            borderWidth: 0,
            floating: true,
            rtl: true,
            y: 15,
            margin: 10,
            useHTML: true,
            itemStyle: {
                fontFamily: 'Arial, Helvetica, sans-serif',
                fontWeight: 'bold'
            }
            *******************/
        },
        series: [
        {
            name: 'b',
            data: [0.5,1,1.5,2,2.5,3,3.5,4]
        },
        {
            name: '<span class="abc">a</span>',
            data: [4,8,12,16,20,24,28,32]
        }
        ]
    },function(chart) { //LOGO
         chart.renderer.image('/images/small_logo.png', 670, 18, 31, 23).add();
        }
);
here is an image of what i want to achieve

回答1:
You just have to change you min value :
xAxis: {
    ...
    min: 0.5,
    ...
},
Look at this : http://jsfiddle.net/yKHsD/
EDIT :
There is a better solution. It is caused by the categories option. You can avoid this problem by doing :
var xCategories = ['1','2','3','4','5','6','7','8'];
// ...
xAxis: {
    ....
    tickmarkPlacement: 'on',
    labels: {
        formatter: function() {
            return xCategories[this.value];
        }
    },
    startOnTick: false,
    endOnTick: false,
    minPadding: 0,
    maxPadding: 0,

    gridLineWidth: 1
},
In this example, don't forget to remove the categories option. Here is an example : http://jsfiddle.net/yKHsD/1/
来源:https://stackoverflow.com/questions/18052324/highcharts-start-from-hinges-base