问题
I want to compare two columnnames from two data frames and create graphs with the matched columnnames from the original data frames.
a<-data.frame(a1=c(1,2,3,4,5),a2=c(2,3,4,5,6),b1=c(3,4,5,6,7),c1=c(4,5,6,7,8))
b<-data.frame(c1=c(10,20,30,40,50),b1=c(20,30,40,50,60),d1=c(30,40,50,60,70))
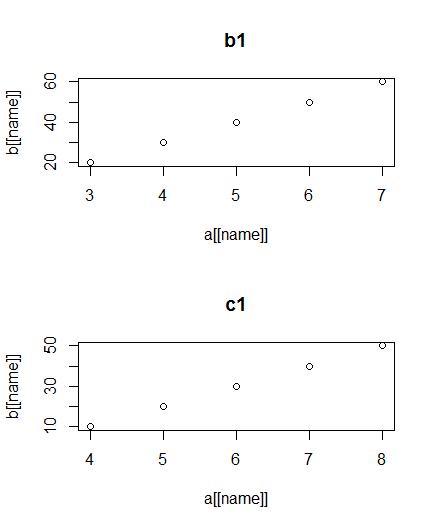
Output should be like: plot (b$c1,a$c1) plot (b$b1,a$b1)
I can create the plots with the above codes, but I need it to be automated because my dataframe is too large.
回答1:
Here's one way:
shared.names <- intersect(names(a), names(b))
par(mfrow=n2mfrow(length(shared.names)))
for (name in shared.names) plot(a[[name]], b[[name]], main=name)

来源:https://stackoverflow.com/questions/16530521/compare-column-names-and-make-plots