问题
I have following data:
    I   II  Total
A   15  25  40
B   5   45  50
C   15  5   20
R data input:
group <- c("A", "B", "C", "A", "B", "C")
subgroup <- c("I", "I", "I", "II", "II", "II")
yvar <- c(15, 5, 15, 25, 45, 5)
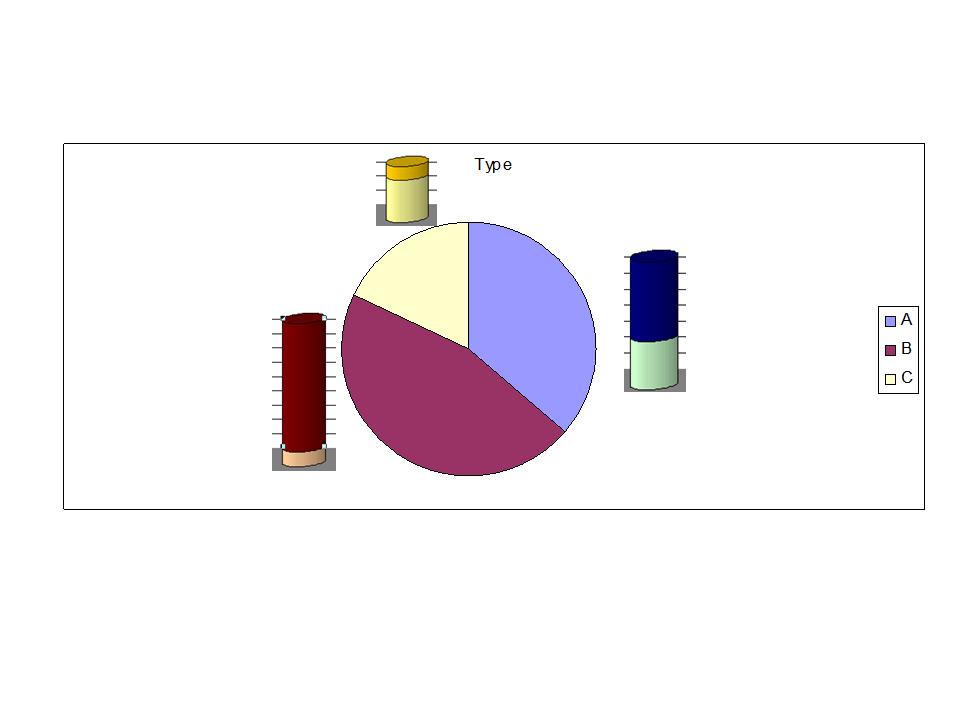
As I was thinking a better way to present it, I came to idea of pie chart (preferably 3D) combined with bar chart (preferably 3D). Here is my rough sketch of my idea where bar chart is embedded into pie chart. Please suggest me if you have any other innovative idea to present such data.


回答1:
Come on, lets go wild with the pies! I suggest you just go for pie-only solution - who needs bar charts anyway. Just get plotrix package. Here is how I would display matrix of 6 numbers in the form of pie charts.
plot(1:5,type="n",main="Pie charts are evil",xlab="",ylab="",axes=FALSE)#empty plot
require(plotrix)
main_col <- c("#ff0000","#80ff00","#00ffff")#nice colors
main_pie <- floating.pie(3,3,c(40,50,20), col=main_col,radius=1)#your big pie
#here are your small pies with labels using plotrix functions
small_col <- c("black","white")
small_lab <- c("I","II")
A <- floating.pie(3.8,4.5,c(15,5), col=small_col,radius=0.2)
pie.labels(3.8,4.5,A,small_lab,border=F,radius=0.3,cex=0.8)
B <- floating.pie(1.7,2,c(15,25), col=small_col,radius=0.2)
pie.labels(1.7,2,B,small_lab,border=F,radius=0.3,cex=0.8)
C <- floating.pie(4.3,2,c(5,45), col=small_col,radius=0.2)
pie.labels(4.3,2,C,small_lab,border=F,radius=0.3,cex=0.8)
#and finally very useful legend
legend("right",legend=c("A","B","C"),col=main_col,bty="n",pch=15)

回答2:
I cannot recommend strongly enough that you read some of Edward Tufte's literature on graphs and the display of quantitative data. Pie charts are close to the worst possible way to impart information to the user. Use of "3-D" images (e.g. bars) in charts is considered puerile at best -- it does nothing to improved readability or information flow.
So let me ask: what information (and what conclusions) are you trying to give to your reader? Why would you want to present the same information twice?
回答3:
Please suggest me if you have any other innovative idea to present such data
I don't have an innovative idea, but I do have what I think is a better way.
Think about your data. It's divided into groups (A, B, C), each of which also has a subgroup (I, II). So when you plot the data, you need 2 "visual aids": one of which illustrates the main groups and a second showing the subgroups.
A sensible way to do this is to separate the main groups by position and indicate the subgroups by colour.
So, you can reshape your data into a data frame (df1) which looks like this:
  group subgroup yvar
1     A        I   15
2     B        I    5
3     C        I   15
4     A       II   25
5     B       II   45
6     C       II    5
And then use ggplot to generate a stacked bar plot:
library(ggplot)
ggplot(df1, aes(x = group, y = yvar, fill = subgroup)) + geom_bar()
Result:

Note that ggplot calculates the totals for you. Look at that, look at your combined 3D bar + pie charts and ask yourself: which one best conveys the key features of the data, at a glance?
Please trust me and the data visualization experts on this forum when we tell you: what matters is clear presentation, not "what business people want."
回答4:
I agree with some of the other answerers that a piechart may not be the best way of graphing this kind of data. I'd much rather go for a line plot with a line for each of the subcategories.
A quick google for "R create pie charts" lead showed this link as the first hit. It shows a plethora of options to create piecharts. A similar google for barcharts lead to this link.
In regard to combining the plots, I'd create the plots seperately and combine them using a drawing program such as the gimp or inkscape. This is especially effective when you do not want to create these kinds of plots dozens of times.
回答5:
Have you thought of using python/matplotlib? Equally free and good, and has options for (a) pie chart and (b) overlaying graphs on other graphs, which might do what you want.
http://matplotlib.sourceforge.net/gallery.html
Or you could do an exploded pie chart to show subcategories:
http://matplotlib.sourceforge.net/examples/pylab_examples/pie_demo.html
来源:https://stackoverflow.com/questions/8742604/can-i-make-such-graph-in-r-bar-chart-embedded-in-pie-chart