问题
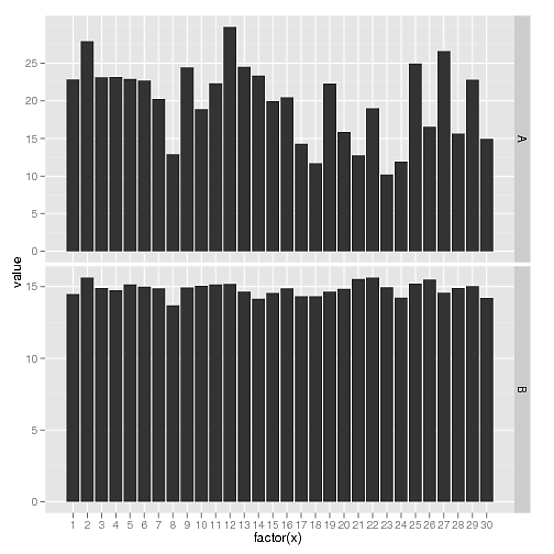
I have data with about 30 categories for the X axis in two groups for faceting. I will show this with some random data:
dataf <- data.frame(x=c(1:30), A=rnorm(30,20,5), B=rnorm(30,15,0.5))
datam <- melt(dataf, id="x")
ggplot(datam, aes(factor(x), value)) +
  geom_bar(stat="identity") +
  facet_grid(variable ~ .)

This is just lovely, except that it would be easier to quickly read off categories on the top grouping if the x axis was reproduced on that graph too. However
ggplot(datam, aes(factor(x), value)) +
  geom_bar(stat="identity") +
  facet_grid(variable ~ ., scales="free")
makes no difference to the x axis because, I guess, the values are the same for both groupings.
How can I force the X axis to be reproduced for the top group as well of bars?
回答1:
Try using facet_wrap instead:
ggplot(datam, aes(factor(x), value)) +
    geom_bar(stat="identity") +
    facet_wrap(~variable,nrow = 2,scales = "free")

来源:https://stackoverflow.com/questions/10913840/force-x-axis-on-both-graphs-in-a-facet-grid-when-x-values-are-the-same