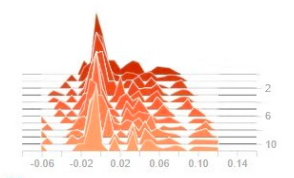
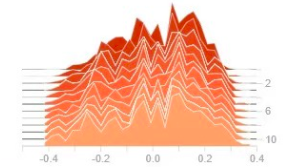
这是线上产品的截图:


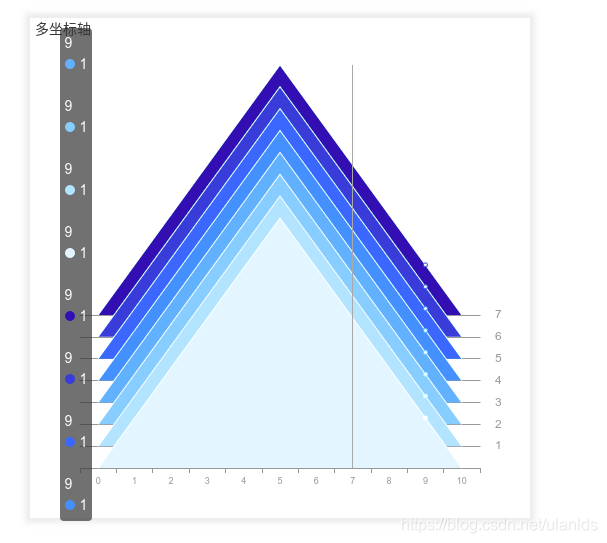
实现的demo效果图如下:(这里的数据是自己造的,是这样的效果,实际数据绘制的图和上图↑↑↑↑↑一致)

代码如下:
<!DOCTYPE html>
<html lang="en">

<head>
  <meta charset="UTF-8">
  <meta name="viewport" content="width=device-width, initial-scale=1.0">
  <meta http-equiv="X-UA-Compatible" content="ie=edge">
  <title>多坐标轴图表</title>
  <script src="https://cdnjs.cloudflare.com/ajax/libs/echarts/4.2.1/echarts-en.common.js"></script>
  <style>
    #chart {
      width: 500px;
      height: 500px;
      position: absolute;
      left: 0;
      right: 0;
      top: 0;
      bottom: 0;
      margin: auto;
      box-shadow: 0 0 5px 5px #eee;
    }
  </style>
</head>

<body>
    <div id="chart"></div>
  <script>
    var data = [{
      "xAxis": [0, 1, 2, 3, 4, 5, 6, 7, 8, 9, 10],
      "yAxis": [0, 1, 2, 3, 4, 5, 4, 3, 2, 1, 0]s
    }, {
      "xAxis": [0, 1, 2, 3, 4, 5, 6, 7, 8, 9, 10],
      "yAxis": [0, 1, 2, 3, 4, 5, 4, 3, 2, 1, 0]
    }, {
      "xAxis": [0, 1, 2, 3, 4, 5, 6, 7, 8, 9, 10],
      "yAxis": [0, 1, 2, 3, 4, 5, 4, 3, 2, 1, 0]
    }, {
      "xAxis": [0, 1, 2, 3, 4, 5, 6, 7, 8, 9, 10],
      "yAxis": [0, 1, 2, 3, 4, 5, 4, 3, 2, 1, 0]
    }, {
      "xAxis": [0, 1, 2, 3, 4, 5, 6, 7, 8, 9, 10],
      "yAxis": [0, 1, 2, 3, 4, 5, 4, 3, 2, 1, 0]
    },{
      "xAxis": [0, 1, 2, 3, 4, 5, 6, 7, 8, 9, 10],
      "yAxis": [0, 1, 2, 3, 4, 5, 4, 3, 2, 1, 0]
    },{
      "xAxis": [0, 1, 2, 3, 4, 5, 6, 7, 8, 9, 10],
      "yAxis": [0, 1, 2, 3, 4, 5, 4, 3, 2, 1, 0]
    },{
      "xAxis": [0, 1, 2, 3, 4, 5, 6, 7, 8, 9, 10],
      "yAxis": [0, 1, 2, 3, 4, 5, 4, 3, 2, 1, 0]
    }];

    function getOption(data) {
      var color = [
        '#e6f7ff',
        '#bae7ff',
        '#91d5ff',
        '#69c0ff',
        '#40a9ff',
        '#1890ff',
        '#096dd9',
        '#0050b3',
        '#003a8c',
        '#002766'
      ]
      var option = {
        tooltip: {
          show: true,
          trigger: 'axis',
          axisPointer: {
            type: 'line',
            z: 101
          },
          position: function (pos, params, el, elRect, size) {
            var obj = {
              top: 10
            }
            obj[['left', 'right'][+(pos[0] < size.viewSize[0] / 2)]] = 30
            return obj
          }
        },
        axisPointer: {
          link: {
            xAxisIndex: 'all'
          },
          label: {
            backgroundColor: '#777'
          }
        },
        title: {
          text: '多坐标轴',
          textStyle: {
            fontSize: '14',
            color: '#333',
            fontWeight: '100'
          }
        },
        grid: [],
        xAxis: [],
        yAxis: [],
        series: []
      }
      for (let i = 0; i < data.length; i++) {
        option.grid.push({
          bottom: (() => {
            var interval = 1
            interval = 35 / data.length
            return 10 + i * interval + '%'
          })(),
          height: '50%'
          // width:'80%',
          // left:5+i/2+'%'
        })
        option.series.push({
          data: data[i].yAxis,
          z: 100 - i,
          type: 'line',
          xAxisIndex: i,
          yAxisIndex: i,
          itemStyle: {
            color: color[i]
          },
          lineStyle: {
            width: 1,
            color: '#fff'
          },
          showSymbol: false,
          areaStyle: {
            opacity: 1,
            color: color[i]
          }
        })
        option.xAxis.push({
          gridIndex: i,
          type: 'category',
          name: i,
          boundaryGap: true,
          axisLine: {
            lineStyle: {
              color: '#999',
              width: 1
            }
          },
          axisLabel: {
            fontSize: 9,
            color: '#999',
            fontWeight: 100,
            show: (() => {
              return i === 0
            })()
          },
          axisTick: {
            show: (() => {
              return i === 0
            })()
          },
          data: data[i].xAxis
        })
        option.yAxis.push({
          gridIndex: i,
          type: 'value',
          show: false,
          max: this.maxVal,
          min: this.minVal
        })
      }

      return option
    }

//--------------------------------这段代码是响应式的(需要的参考)start----------------------------
    // function responsiveChart() {
    //   // 响应式图表
    //   window.addEventListener(
    //     'resize',
    //     this.throttle(() => {
    //       this.myChart && this.myChart.resize()
    //     }, 3)
    //   )
    // }

    // function throttle(fn, delay) {
    //   // 节流函数
    //   let timer
    //   return function (...args) {
    //     if (timer) clearTimeout(timer)
    //     timer = setTimeout(() => {
    //       fn.apply(this, args)
    //     }, delay)
    //   }
    // }
    // responsiveChart()
//--------------------------------------------- end  --------------------------------
    var myChart = echarts.init(document.getElementById('chart'))
    myChart.setOption(getOption(data))
  </script>
</body>

</html>
来源:https://blog.csdn.net/ulanlds/article/details/98883032